Level 3
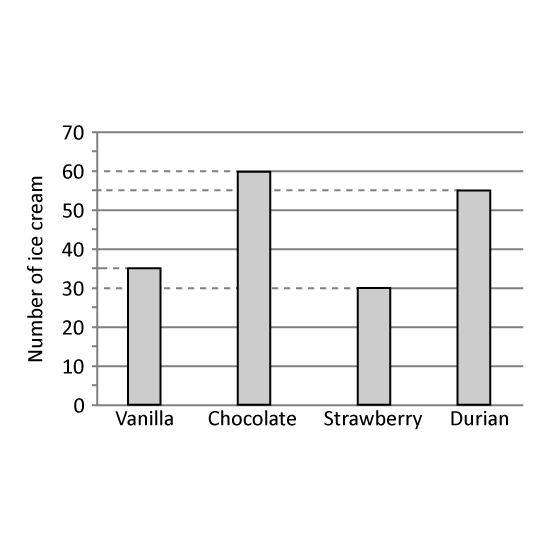
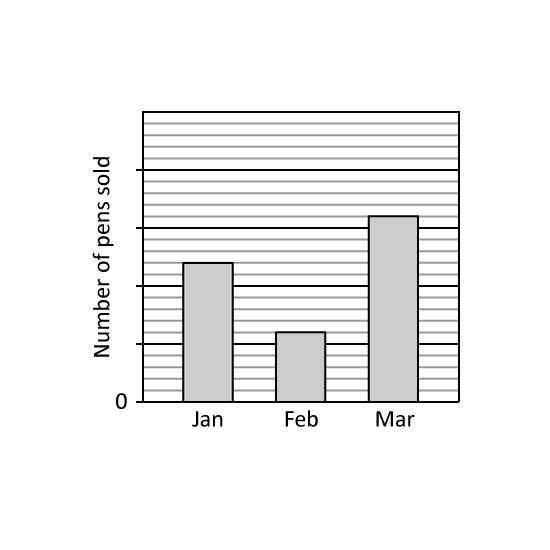
The bar graph shows the number of ice-cream flavours sold at a shop in a day.
What percentage of the ice-creams sold was durian ice-creams? Give your answer correct to 1 decimal place.
The cost of each ice-cream was the same. The amount of money collected for vanilla ice-creams was $15 more than the amount of money collected for strawberry ice-creams. What was the total amount of money collected from the sale of all the ice-creams?
Level 3
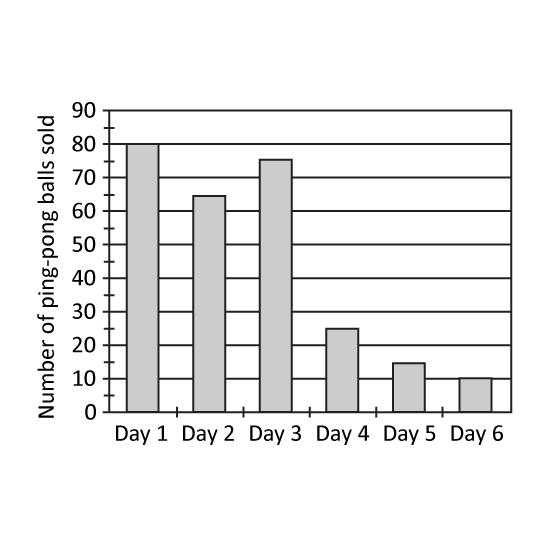
A sports shop had 300 ping-pong balls for sale. Each ping-pong ball is sold at $2. At the end of each day, the number of ping-pong balls was recorded in the bar graph shown.
What fraction of the total number of ping-pong balls was left at the end of Day 3? Express your answer in its simplest form.
If the shop decided to sell every 5 ping-pong balls at $9.30 from Day 4 onwards, how much less would it collect from the sale of the ping-pong balls?
Level 3
A sports shop had 300 ping-pong balls for sale. Each ping-pong ball is sold at $2. At the end of each day, the number of ping-pong balls was recorded in the bar graph shown.
What fraction of the total number of ping-pong balls was left at the end of Day 3? Express your answer in its simplest form.
If the shop decided to sell every 5 ping-pong balls at $9.30 from Day 4 onwards, how much less would it collect from the sale of the ping-pong balls?
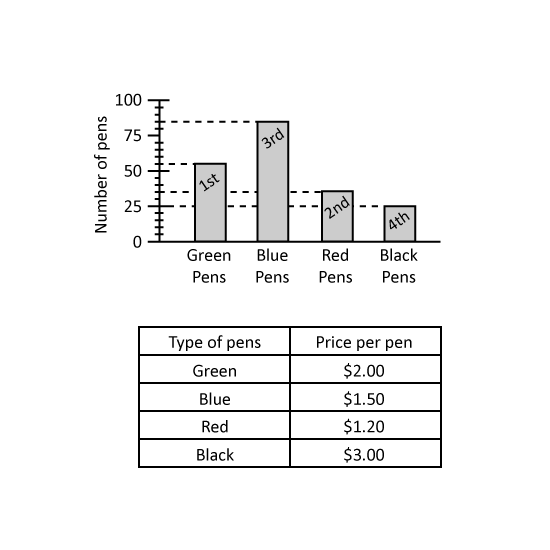
Level 2 PSLE
The bar graph shows the number of coloured pens sold by a shop. The table shows the prices of the pens.
What fraction of the pens sold were black pens? Give the answer in the simplest form.
From the sale of the pens, which coloured pens collected the least amount of money? What was the amount? Give the answers in the following way. (Eg Green, $1)
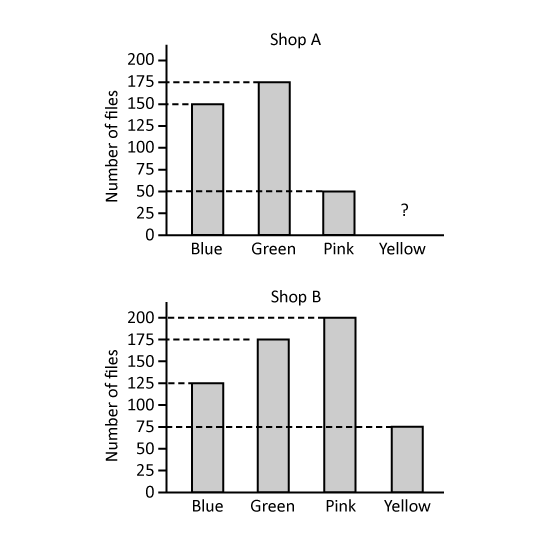
Level 2 PSLE
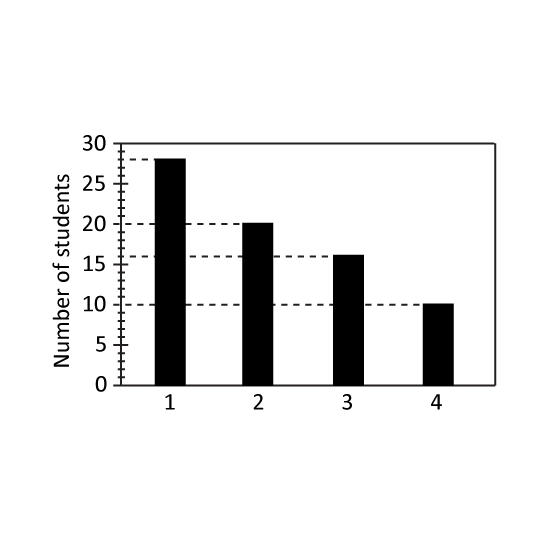
Shops A and B sell highlighters of four colours. The bar graphs show the number of highlighters sold by each shop in April.
The bar for the number yellow highlighters sold by Shop A has not been drawn.
Half of the highlighters sold by Shop A were yellow highlighters. How many yellow highlighters did Shop A sell?
Which colour(s) of highlighters did Shop A sell less than Shop B? (Give your answer(s) in letter(s) in alphabetical order. Eg Blue, Red = B, R
In May, Shop B sold 75 more blue highlighters than the number of blue highlighters sold in April. What was the percentage increase in the number of blue highlighters sold by Shop B from April to May?
Level 2 PSLE
Shops A and B sell highlighters of four colours. The bar graphs show the number of highlighters sold by each shop in April.
The bar for the number yellow highlighters sold by Shop A has not been drawn.
Half of the highlighters sold by Shop A were yellow highlighters. How many yellow highlighters did Shop A sell?
Which colour(s) of highlighters did Shop A sell less than Shop B? (Give your answer(s) in letter(s) in alphabetical order. Eg Blue, Red = B, R
In May, Shop B sold 75 more blue highlighters than the number of blue highlighters sold in April. What was the percentage increase in the number of blue highlighters sold by Shop B from April to May?
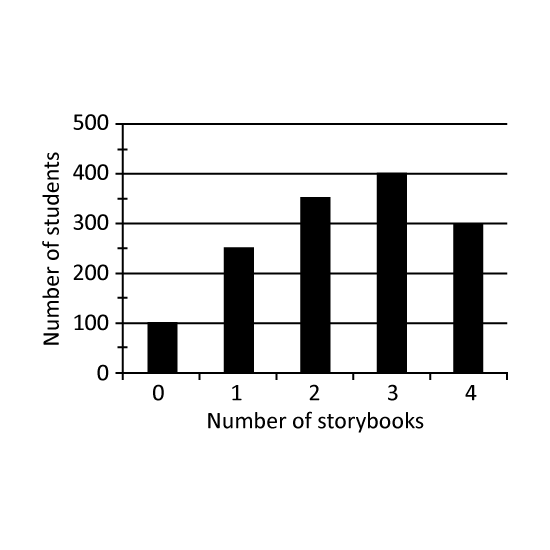
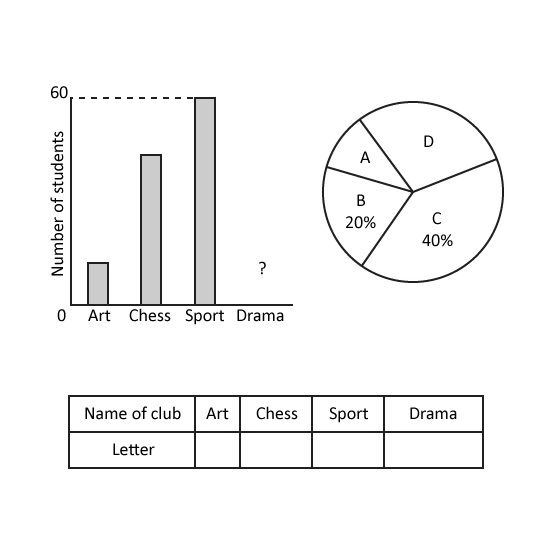
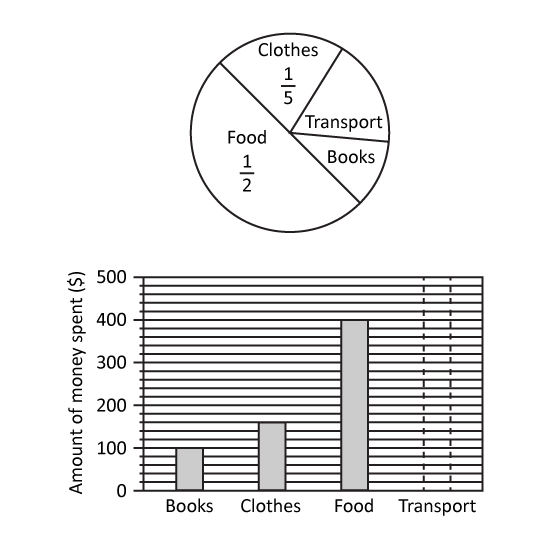
Level 3 PSLE Students joined one of the four clubs. The bar graph represents the number of students in the clubs. The bar for Drama Club is not shown. There were twice as many students in the Drama Club as in the Art Club. The information is also represented by a pie chart. The names of the clubs are represented by the letters A, B, C and D.
Identify the letters with their respective clubs. Give your answers in the following format. (Eg A, B, C, D)
How many students were there altogether?
Level 3 PSLE Students joined one of the four clubs. The bar graph represents the number of students in the clubs. The bar for Drama Club is not shown. There were twice as many students in the Drama Club as in the Art Club. The information is also represented by a pie chart. The names of the clubs are represented by the letters A, B, C and D.
Identify the letters with their respective clubs. Give your answers in the following format. (Eg A, B, C, D)