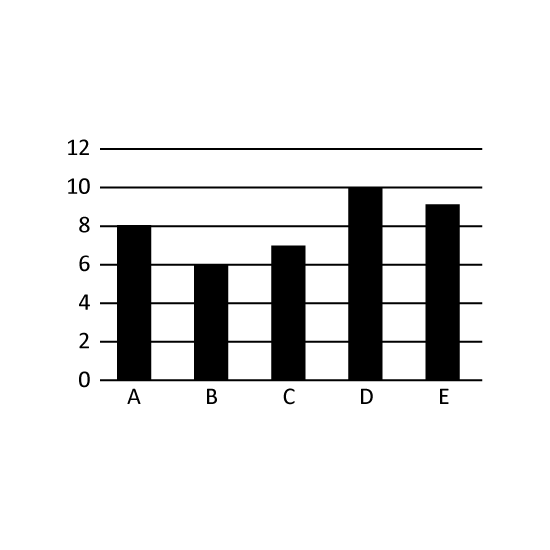
Level 2
The bar graph shows the number of students in each class. How many more students are in Class D than in Class C? Express it as a percentage of the total number of students in all the classes.
Level 2
The bar graph shows the number of students in each class. How many more students are in Class D than in Class C? Express it as a percentage of the total number of students in all the classes.
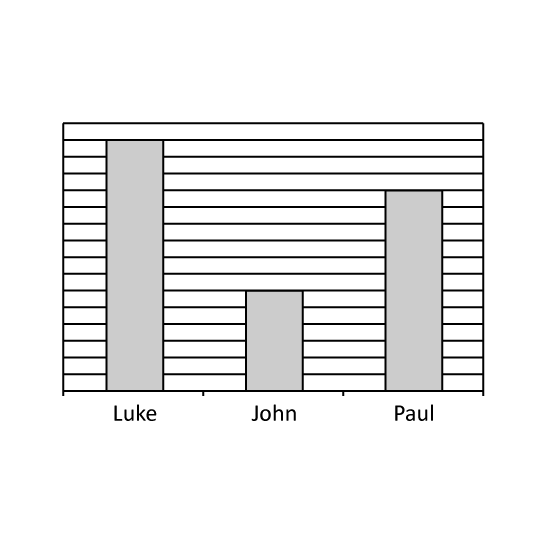
Level 2
The graph shows the number of marks each child scored for their Math test. How many marks did Paul score if Luke scored 54 marks more than John?
Level 2
The graph shows the number of marks each child scored for their Math test. How many marks did Paul score if Luke scored 54 marks more than John?
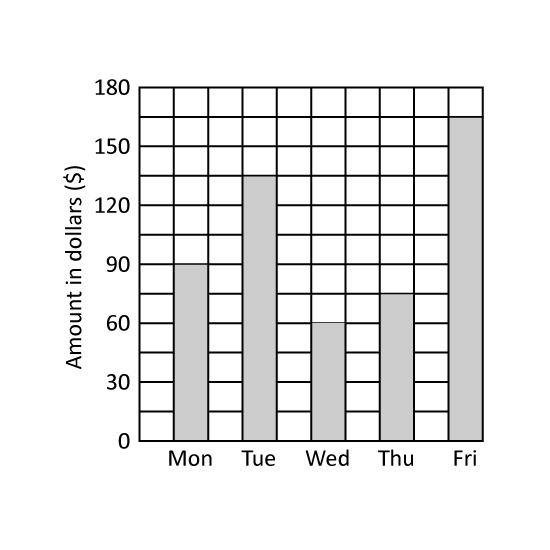
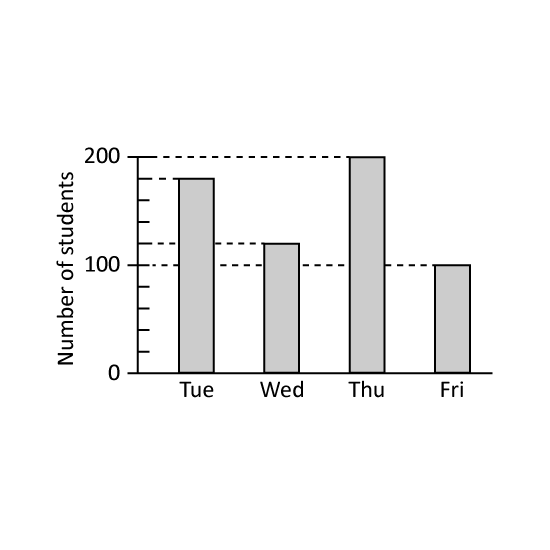
Level 1 PSLE
A school conducted checks on its Primary 6 students' eyesight from Tuesday to Friday. Each student had their eyes checked on one of the four days. The bar graph shows the number of students that were checked on each day. What percentage of the Primary 6 students had their eyes checked on Tuesday?