Level 3
Look at the picture graph.
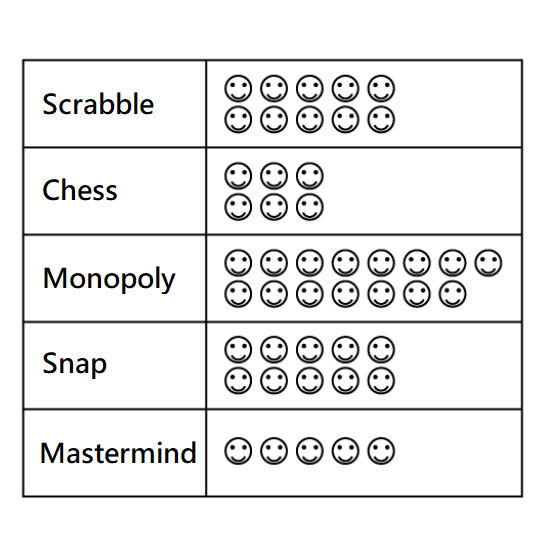
This graph shows the favourite board games of a group of children. Each smiley stands for 1 child. Give the answers in numbers.
_____ children like Scrabble.
5 more children prefer Snap to _____.
_____ fewer children prefer chess to Monopoly.
The same number of children like _____ and _____. (Eg 1, 2)
Level 3
Look at the picture graph.
This graph shows the favourite board games of a group of children. Each smiley stands for 1 child. Give the answers in numbers.
_____ children like Scrabble.
5 more children prefer Snap to _____.
_____ fewer children prefer chess to Monopoly.
The same number of children like _____ and _____. (Eg 1, 2)
Level 1
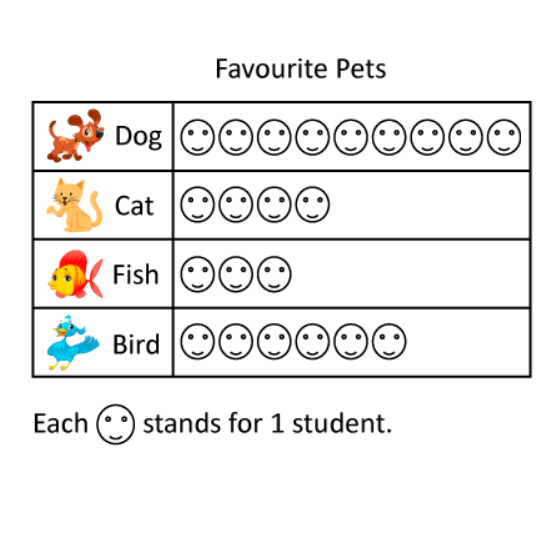
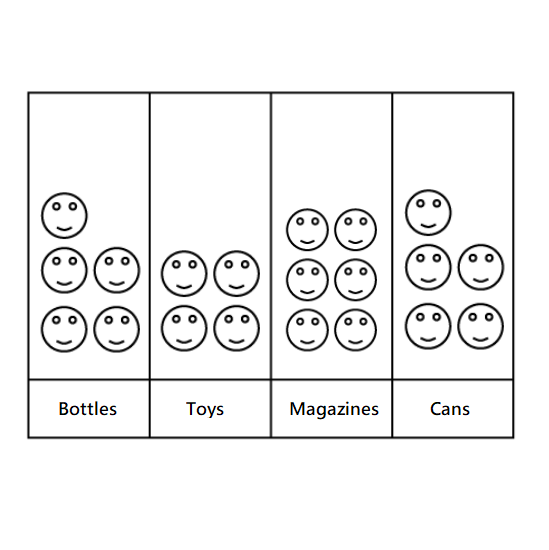
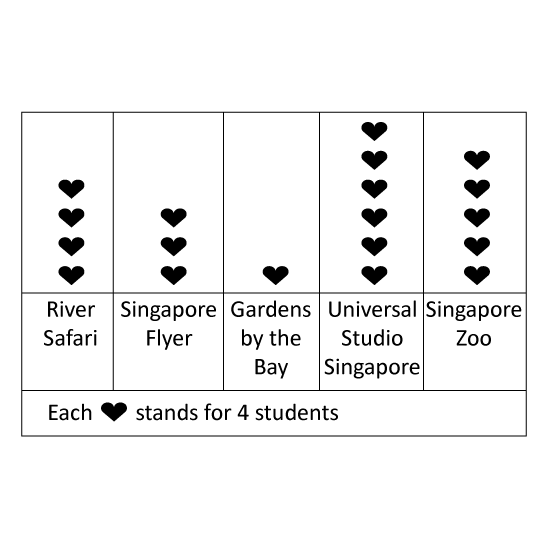
The picture graph shows the favourite tourist attraction of a group of students. How many students chose Universal Studio Singapore as their favourite tourist attraction?
Level 1
The picture graph shows the favourite tourist attraction of a group of students. How many students chose Universal Studio Singapore as their favourite tourist attraction?
Level 1
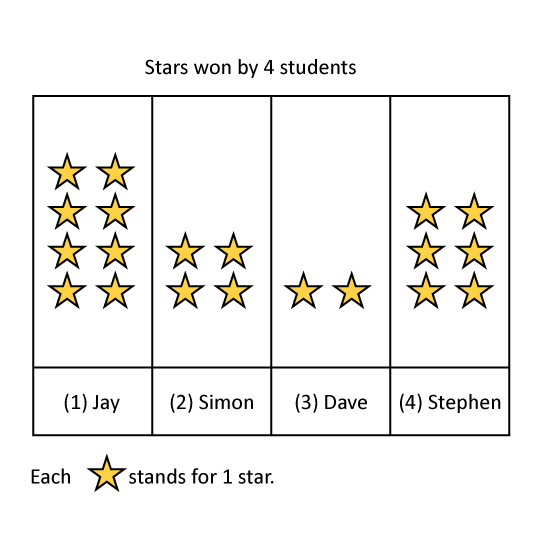
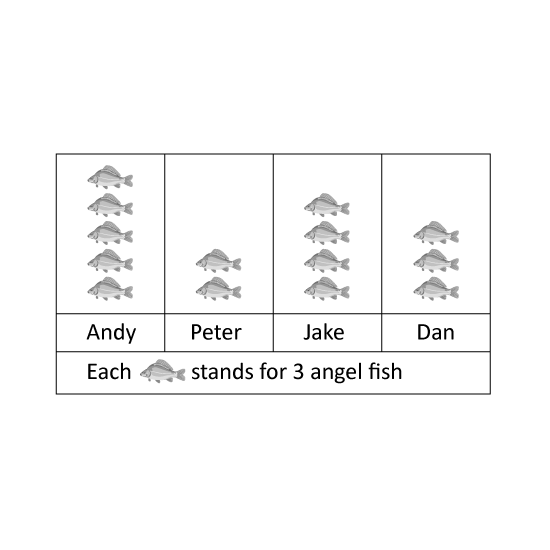
Study the graph carefully.
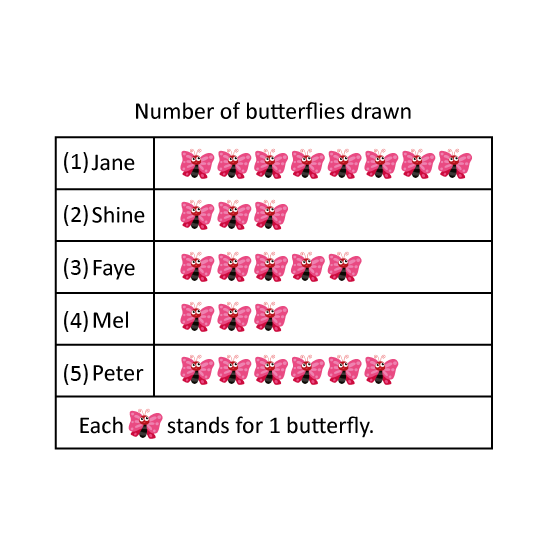
The graph shows the number of angel fish 4 boys keep as pets. How many more angel fish must Peter buy so that he has as many angel fish as Jake?
Level 1
Study the graph carefully.
The graph shows the number of angel fish 4 boys keep as pets. How many more angel fish must Peter buy so that he has as many angel fish as Jake?
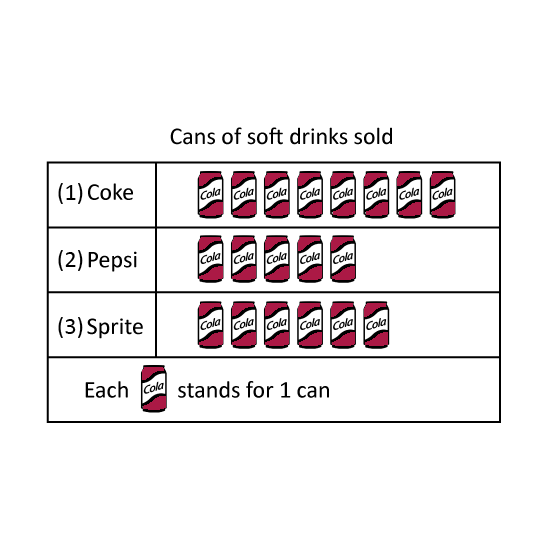
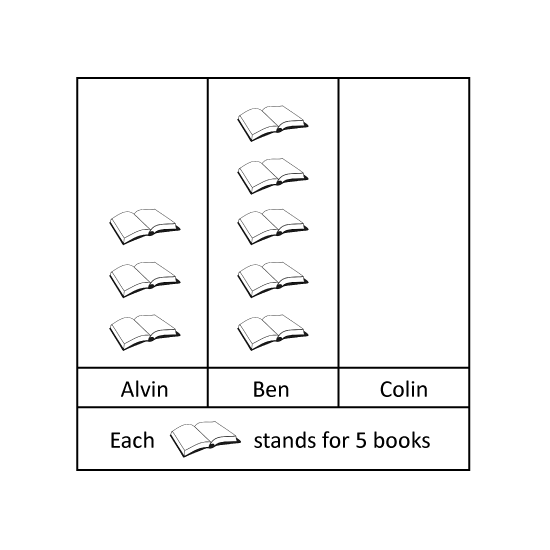
Level 2
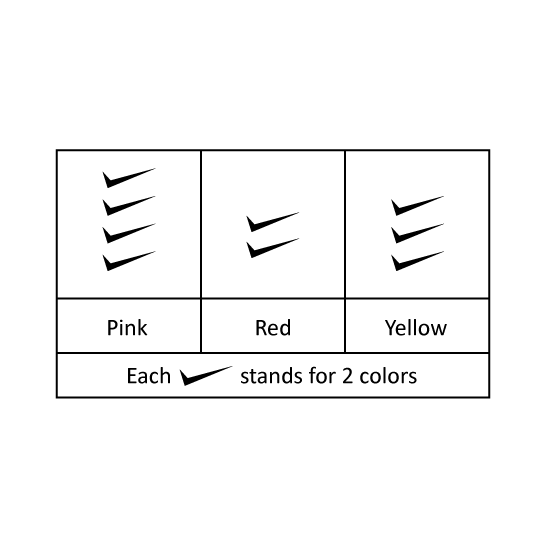
The graph shows the number of books read by Alvin and Ben last month. Colin read three times as many books as Alvin last month. How many books did the 3 boys read together last month?
Level 2
The graph shows the number of books read by Alvin and Ben last month. Colin read three times as many books as Alvin last month. How many books did the 3 boys read together last month?