Level 1
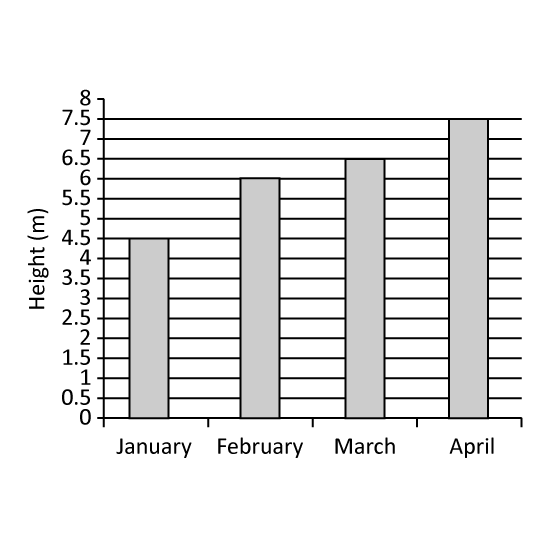
The graph shows the height of a plant on the last day of each month from January to April. In which month was the greatest increase in the plant's plant's height recorded?
Level 1
The graph shows the height of a plant on the last day of each month from January to April. In which month was the greatest increase in the plant's plant's height recorded?
Image in this question is not available.
Level 1
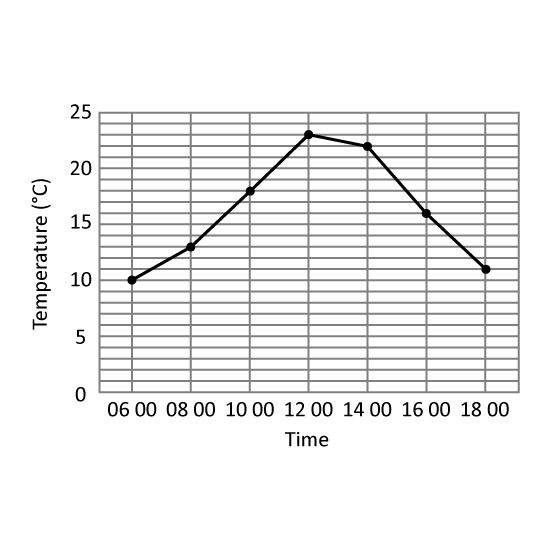
The table shows the temperature change in Hillview Town.
At which 2 hour-interval of the day was there the greatest change in temperature? Give your answer in this format. (Eg 1200 to 1400)
Level 1
The table shows the temperature change in Hillview Town.
At which 2 hour-interval of the day was there the greatest change in temperature? Give your answer in this format. (Eg 1200 to 1400)
Image in this question is not available.
Level 2
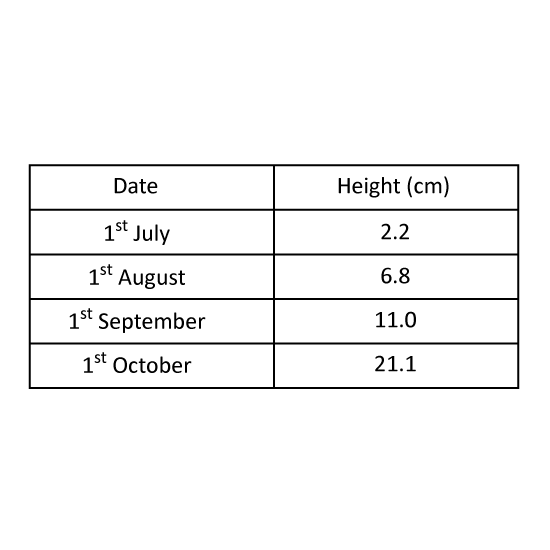
The table shows the height of a plant in centimetres on the first day of each month from July to October. In which month did the plant's height increase the most? Give your answer in this format. (Eg Jan)
Level 2
The table shows the height of a plant in centimetres on the first day of each month from July to October. In which month did the plant's height increase the most? Give your answer in this format. (Eg Jan)
Image in this question is not available.
Level 2
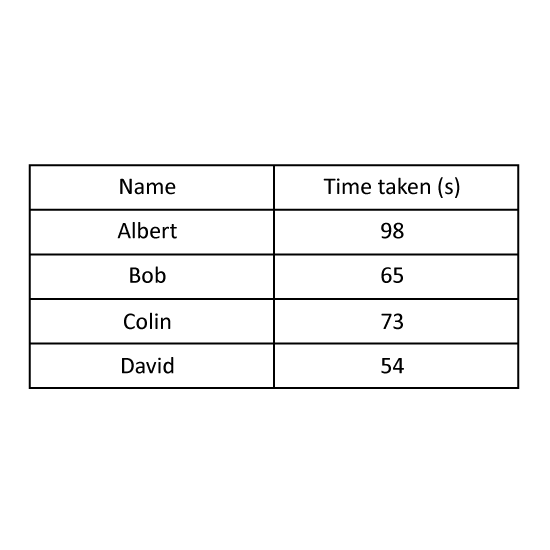
Four boys took part in a race. The table shows the time taken by the four boys.
How much faster was the fastest runner in the race compared to Bob? Give your answer in seconds.
Level 2
Four boys took part in a race. The table shows the time taken by the four boys.
How much faster was the fastest runner in the race compared to Bob? Give your answer in seconds.
Image in this question is not available.
Level 1
Express 30 minutes as a fraction of two hours. Give your answer in its simplest form.
1 m
Image in this question is not available.
Level 1
A car left City A at 11.30 p.m. It reached City B 550 km away at 9.30 a.m. the next morning. What was its speed?
1 m
Image in this question is not available.
Level 1
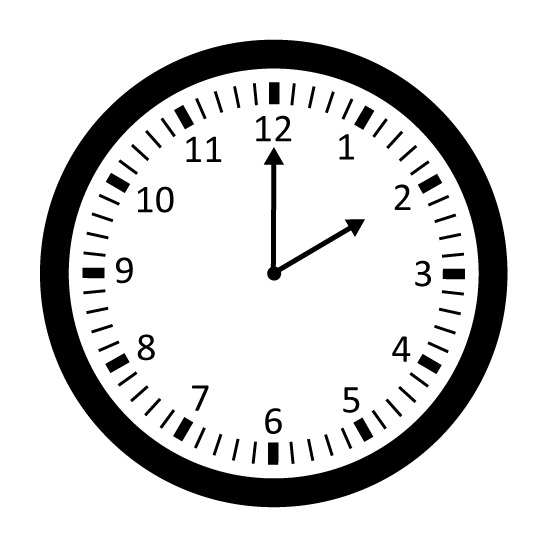
Look at the picture.
What is the time shown on the clock? _____ o'clock
Level 1
Look at the picture.
What is the time shown on the clock? _____ o'clock
Image in this question is not available.
Level 2
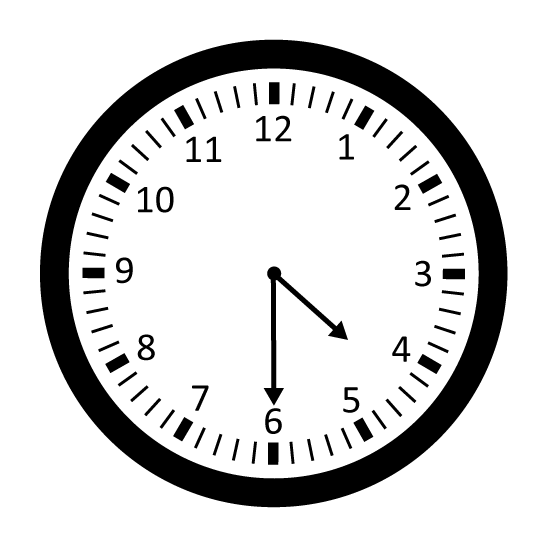
Look at the picture.
What is the time shown on the clock? Half past _____
Level 2
Look at the picture.
What is the time shown on the clock? Half past _____
Image in this question is not available.
Level 2
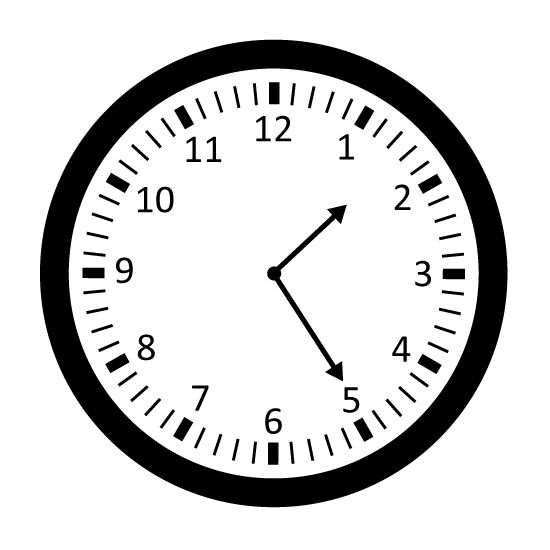
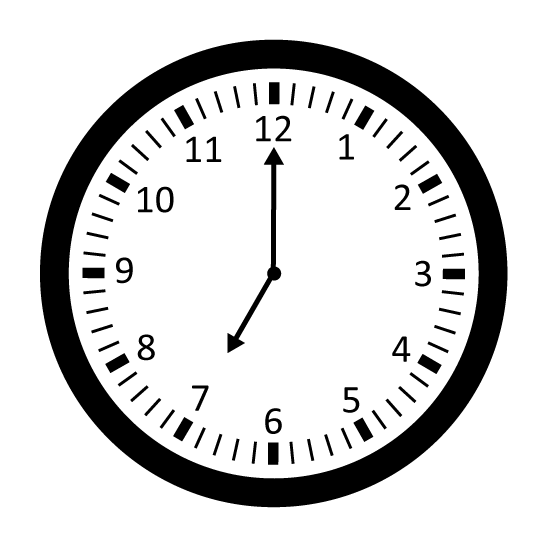
Look at the picture.
What is the time shown on the clock? Give the answer in number.
(1) Half past 4
(2) Half past 5
(3) 4 o'clock
(4) 5 o'clock
Level 2
Look at the picture.
What is the time shown on the clock? Give the answer in number.
(1) Half past 4
(2) Half past 5
(3) 4 o'clock
(4) 5 o'clock
Image in this question is not available.
Level 1
32 min and 8 s = s
1 m
Image in this question is not available.
Level 2
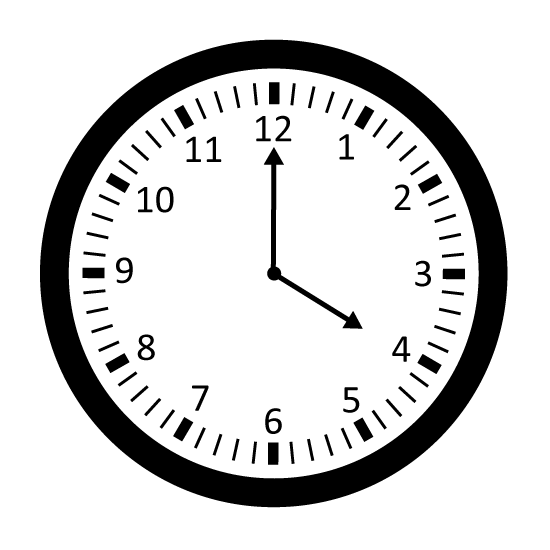
Look at the picture.
Fill in the blank.
The clock shows the time before _____ o'clock.
Level 2
Look at the picture.
Fill in the blank.
The clock shows the time before _____ o'clock.
Image in this question is not available.
Image in this question is not available.
Level 2
Look at the picture.
Fill in the blank.
The clock shows the time after _____o'clock.
Level 2
Look at the picture.
Fill in the blank.
The clock shows the time after _____o'clock.
Image in this question is not available.
Image in this question is not available.
Level 2
Look at the picture.
Write the correct time using 12-hour clock format.
Level 2
Look at the picture.
Write the correct time using 12-hour clock format.
Image in this question is not available.
Level 1
Look at the picture.
Write the time shown on the clock in 12-hour format.
Level 1
Look at the picture.
Write the time shown on the clock in 12-hour format.
Image in this question is not available.
Level 1
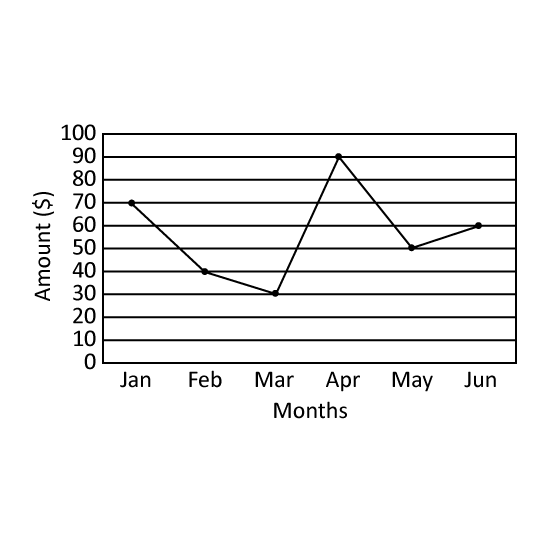
The line graph shows the amount of utility bills paid by Mr Gann's household in the first six months of the year. In which month did the greatest decrease in utility bills occur? Give the answer in short form. (Eg Jan)
Level 1
The line graph shows the amount of utility bills paid by Mr Gann's household in the first six months of the year. In which month did the greatest decrease in utility bills occur? Give the answer in short form. (Eg Jan)
Image in this question is not available.
Level 1
Look at the picture.
Write the time shown on the clock in 12-hour format.
Level 1
Look at the picture.
Write the time shown on the clock in 12-hour format.
Image in this question is not available.
Level 1
Look at the picture.
Fill in the blank. Give the answer in 12-hour format.
Ben goes to school at ______.
Level 1
Look at the picture.
Fill in the blank. Give the answer in 12-hour format.
Ben goes to school at ______.
Image in this question is not available.
Level 1
Jamila took 1 hour 25 minutes to travel from school to his house. If he arrived home at 3.30 p.m., what time did he leave the school? (Give your answer in 12-hour clock format.)
1 m
Image in this question is not available.