Level 1 PSLE
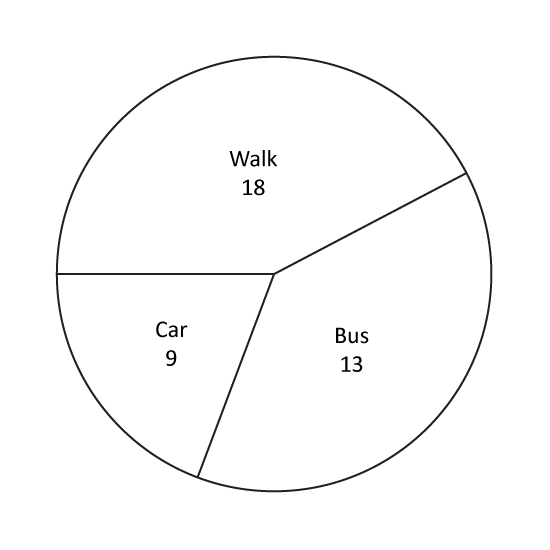
A group of 200 pupils was asked to name their favourite sports. The pie chart shows their choices and the number of pupils who chose each of the sports. Which sports was chosen by 25% of the pupils? Give the answer in letter.
Level 1 PSLE
A group of 200 pupils was asked to name their favourite sports. The pie chart shows their choices and the number of pupils who chose each of the sports. Which sports was chosen by 25% of the pupils? Give the answer in letter.
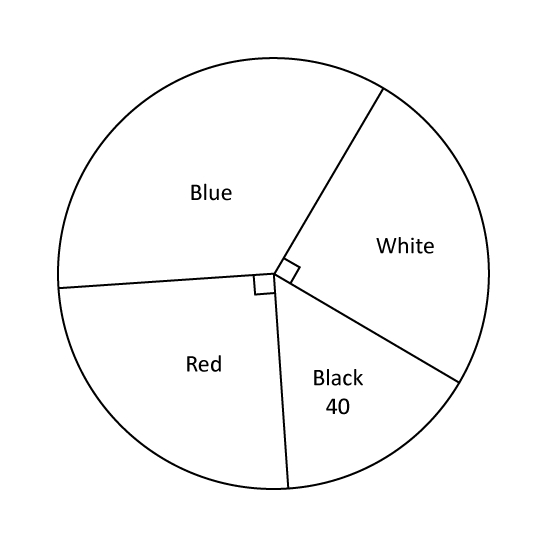
Level 2 PSLE A box contained black balls and green balls. 40% of the balls were green. After some red balls were added to the box, 28% of the balls were green. What percentage of the balls in the box were red?
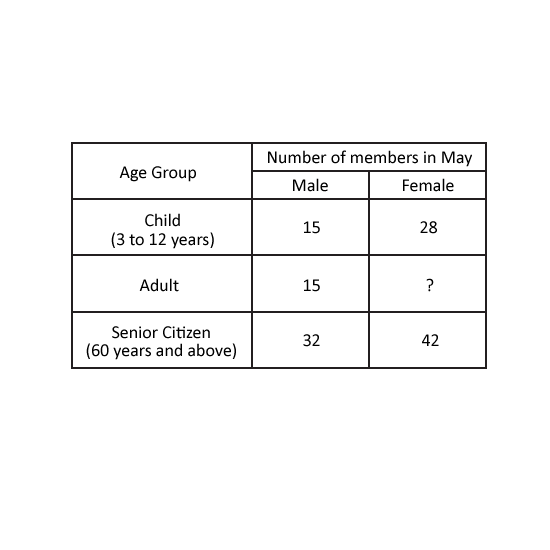
Level 2 PSLE The table shows the number of male and female members in a club in May. The number of female adults is not shown.
50% of all the female members in the club were adults. How many female adults were there in the club?
In June, some female adults left the club. There was no change in the number of members in the other 5 groups. Did the percentage of male members in the club increase, decrease or remain the same from May to June? Give your answer in the following format. (Increase = i; Decrease = d; Remain the same = s) (Eg i)
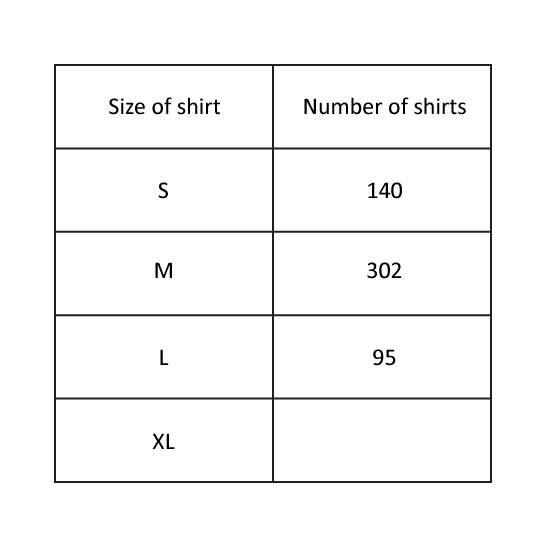
Level 2 PSLE
A shop sells shirts in four different sizes. The table shows the number of T-shirts sold in June for size S, M and L but not XL.
50% of the shirts sold were in size M. How many of the shirts sold were in size XL?
In July the number of shirts sold in size XL remained the same but there
was an increase in the number of shirts sold in the other sizes. Did the percentage of the shirts sold in size XL (1) increase, (2) decrease or (3) remain the same from June to July? Give the answer in number. (Eg 1)