Level 1
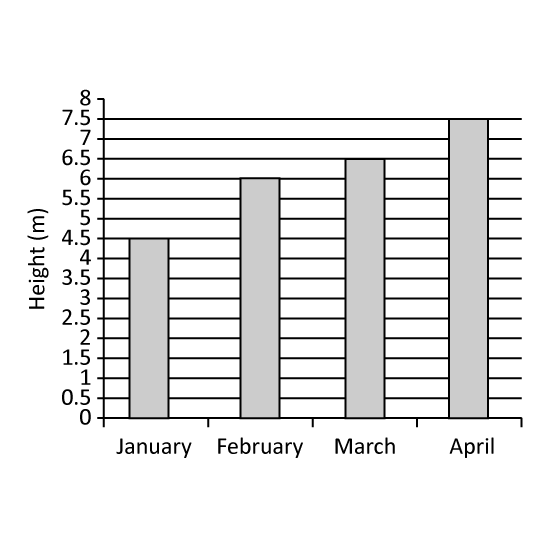
The graph shows the height of a plant on the last day of each month from January to April. In which month was the greatest increase in the plant's plant's height recorded?
Level 1
The graph shows the height of a plant on the last day of each month from January to April. In which month was the greatest increase in the plant's plant's height recorded?
Level 1
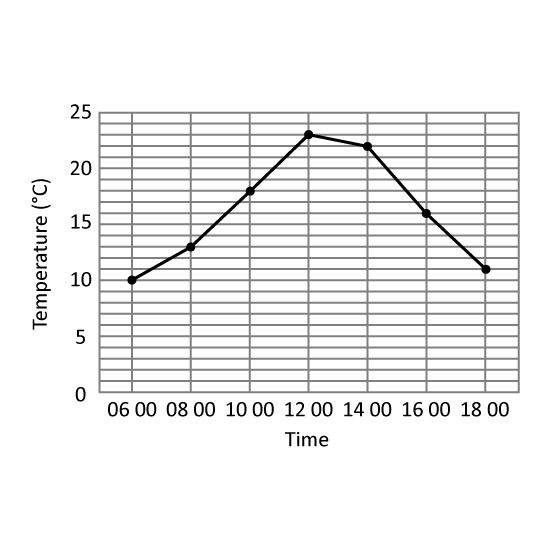
The table shows the temperature change in Hillview Town.
At which 2 hour-interval of the day was there the greatest change in temperature? Give your answer in this format. (Eg 1200 to 1400)
Level 1
The table shows the temperature change in Hillview Town.
At which 2 hour-interval of the day was there the greatest change in temperature? Give your answer in this format. (Eg 1200 to 1400)
Level 1
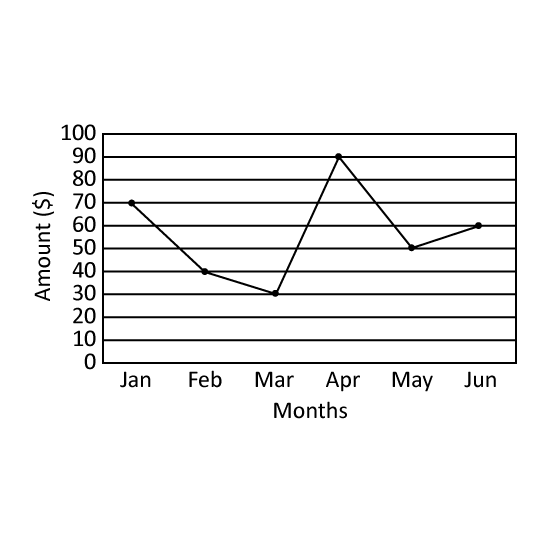
The line graph shows the amount of utility bills paid by Mr Gann's household in the first six months of the year. In which month did the greatest decrease in utility bills occur? Give the answer in short form. (Eg Jan)
Level 1
The line graph shows the amount of utility bills paid by Mr Gann's household in the first six months of the year. In which month did the greatest decrease in utility bills occur? Give the answer in short form. (Eg Jan)
Level 2 Two numbers add up to 1.48. Both of the numbers are less than 1. One of them has 1 decimal place and the other has 2 decimal places. What is the largest possible difference between the two numbers?