Level 1 PSLE
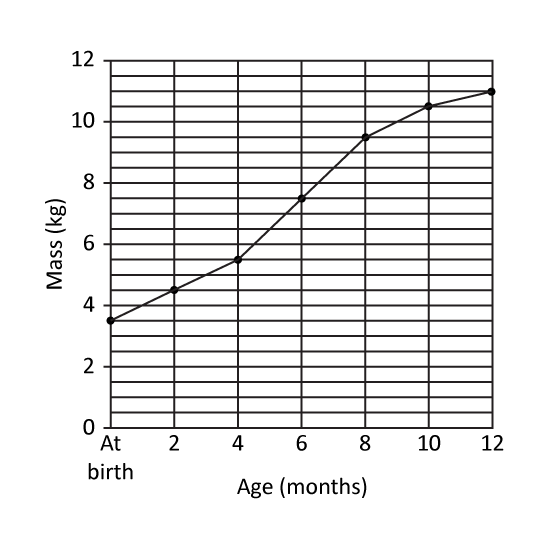
The line graph shows Kenneth's mass from birth to his first birthday. At what age was Kenneth's mass 3 times his mass at birth? _____ months
Level 1 PSLE
The line graph shows Kenneth's mass from birth to his first birthday. At what age was Kenneth's mass 3 times his mass at birth? _____ months
Level 1 PSLE
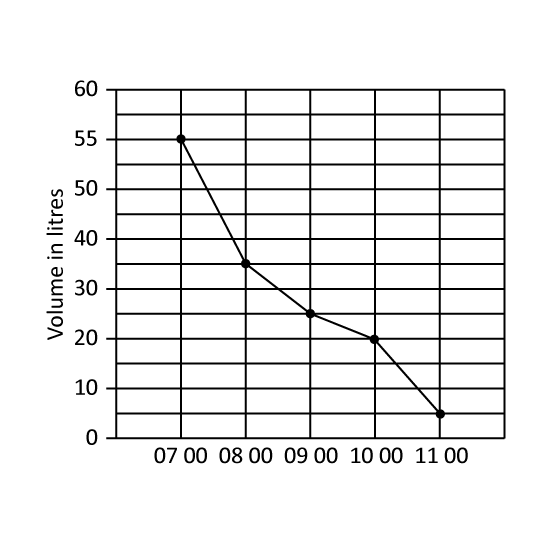
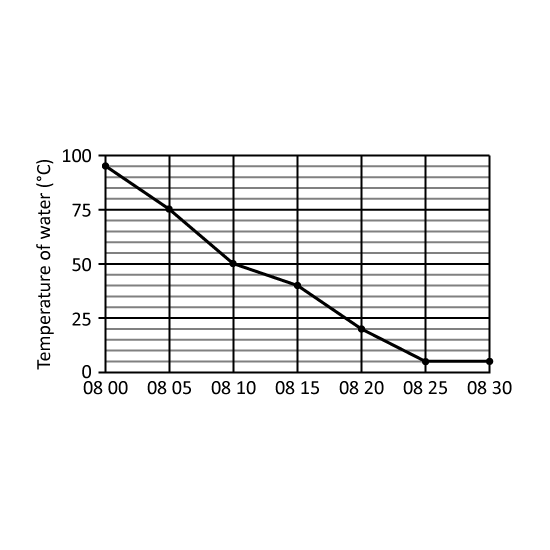
A tank was filled with 55 litre of water at 07 00. Water flowed out of the tank from 07 00 to 11 00. The line graph shows the amount of water in the tank from 07 00 to 11 00.
During which one-hour period was the decrease in the volume of water the greatest?
Give your answer in number. (Eg 1)
(1) From 0700 to 0800
(2) From 0700 to 0900
(3) From 0900 to 1000
(4) From 1000 to 1100
Level 1 PSLE
A tank was filled with 55 litre of water at 07 00. Water flowed out of the tank from 07 00 to 11 00. The line graph shows the amount of water in the tank from 07 00 to 11 00.
During which one-hour period was the decrease in the volume of water the greatest?
Give your answer in number. (Eg 1)
(1) From 0700 to 0800
(2) From 0700 to 0900
(3) From 0900 to 1000
(4) From 1000 to 1100
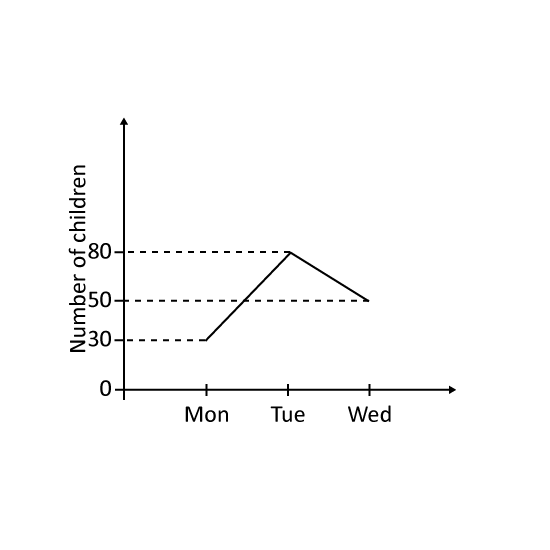
Level 1 PSLE The graph shows the number of children at the camp from Monday to Wednesday. The number of children at a club increased by (a) _____ from Monday to Tuesday and decreased by (b) _____ from Tuesday to Wednesday.
Level 1 PSLE The graph shows the number of children at the camp from Monday to Wednesday. The number of children at a club increased by (a) _____ from Monday to Tuesday and decreased by (b) _____ from Tuesday to Wednesday.
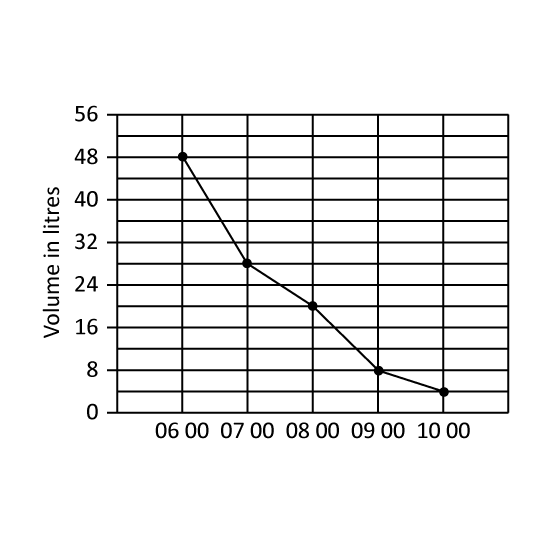
Level 1 PSLE A tank was filled with 48 litres of water at 06 00. Water flowed out of the tank from 06 00 to 11 00. The line graph shows the amount of water in the tank from 06 00 to 10 00. What was the average decrease in the volume of water in litres per hour from 06 00 to 10 00? (Give your answer in ℓ.)
Level 1 PSLE A tank was filled with 48 litres of water at 06 00. Water flowed out of the tank from 06 00 to 11 00. The line graph shows the amount of water in the tank from 06 00 to 10 00. What was the average decrease in the volume of water in litres per hour from 06 00 to 10 00? (Give your answer in ℓ.)
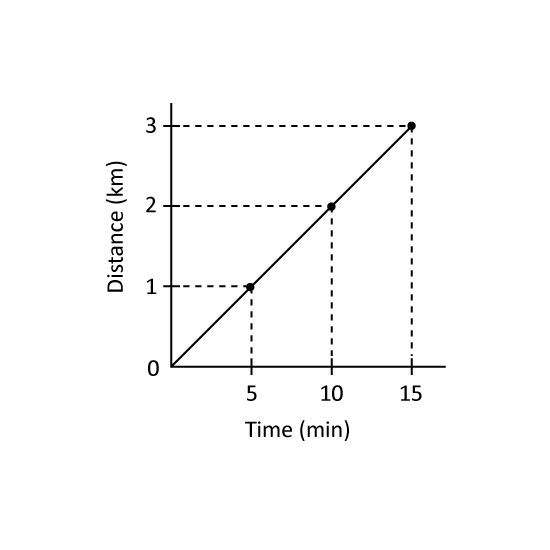
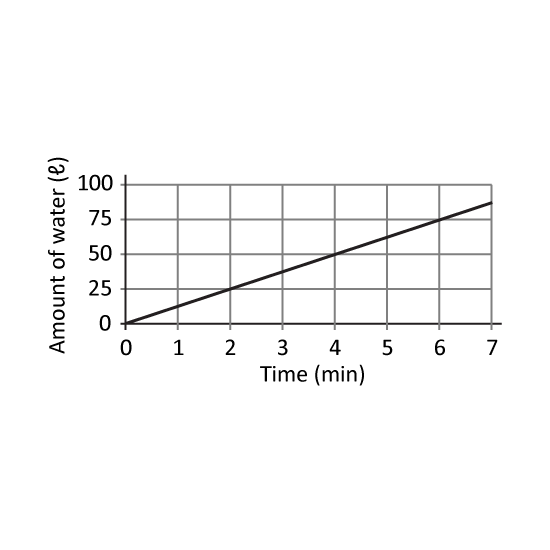
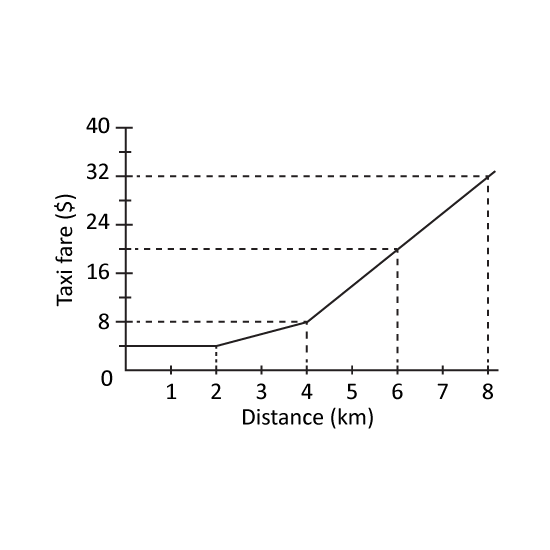
Level 2 PSLE Bryan cycles at a constant speed from home to work. The graph shows the distance Bryan cycles for the first 15 minutes.
The distance between Bryan's home and work is 7.5 km.
How many minutes does Bryan take to cycle from home to work?
What is Bryan's cycling speed in km/h?
Level 2 PSLE Bryan cycles at a constant speed from home to work. The graph shows the distance Bryan cycles for the first 15 minutes.
The distance between Bryan's home and work is 7.5 km.
How many minutes does Bryan take to cycle from home to work?
Level 2 PSLE
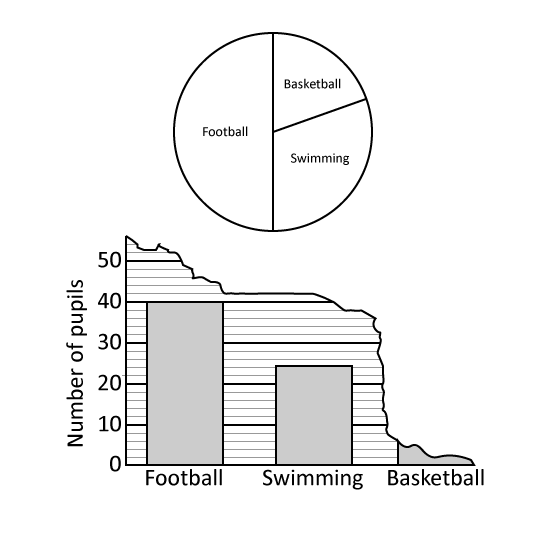
A group of boys were asked to choose their favourite sport from swimming, basketball and football. The pie chart represents the boys choices. Half of the group chose football.
What percentage of the group chose swimming?
The boys' choices were also represented by a bar graph. Part of the graph had been torn off. How many boys chose basketball?
Level 2 PSLE
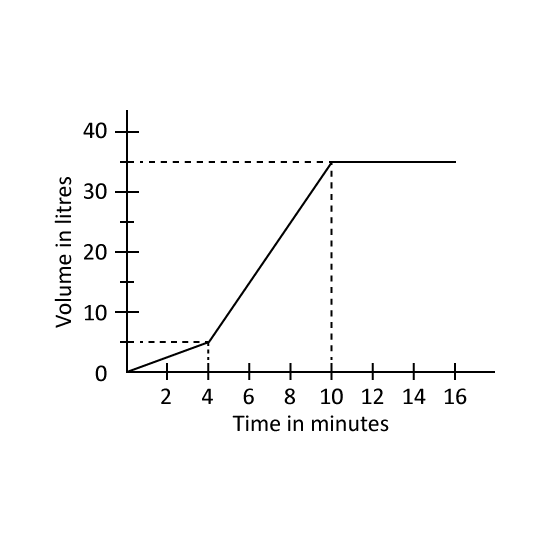
Carlo filled a container with water using two taps. He turned on Tap A first and after 4 minutes, he also turned on Tap B. Both taps were turned off at the same time when the container was completely filled without overflowing. The graph shows the amount of water in the container over 16 minutes.
What fraction of the container was filled 4 minutes after Tap A was turned on? Express your answer in the simplest form.
In one minute, how many litres of water flowed from Tap B?
Level 2 PSLE
Carlo filled a container with water using two taps. He turned on Tap A first and after 4 minutes, he also turned on Tap B. Both taps were turned off at the same time when the container was completely filled without overflowing. The graph shows the amount of water in the container over 16 minutes.
What fraction of the container was filled 4 minutes after Tap A was turned on? Express your answer in the simplest form.
In one minute, how many litres of water flowed from Tap B?
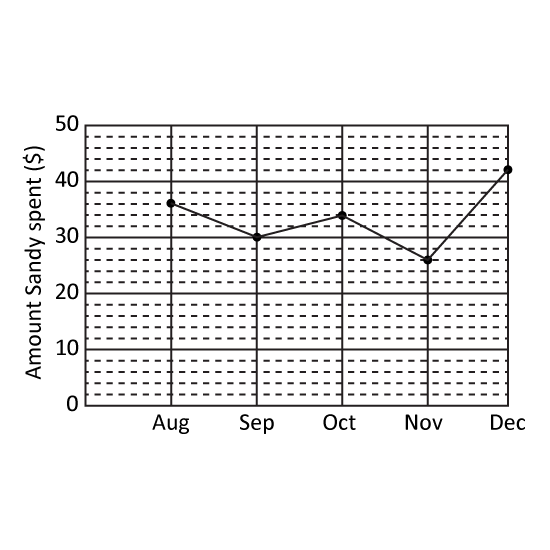
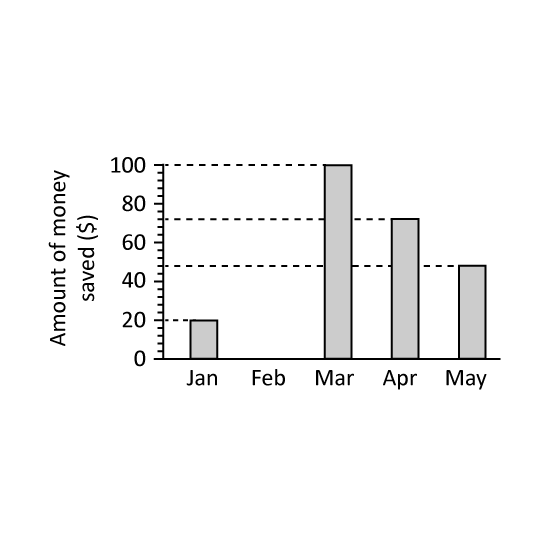
Level 2 The graph shows the amount of money Ron saved from his pocket money every month from January to May.
How much money did Ron save altogether from January to May?
What was the average amount of money Ron saved from January to May?
Ron saved $80 in June. The amount saved increased by 100% from June to July and another 100% from July to August. How much money did Ron save in August?
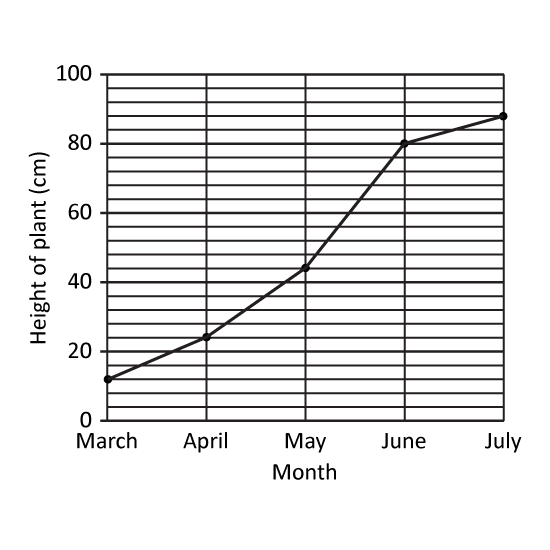
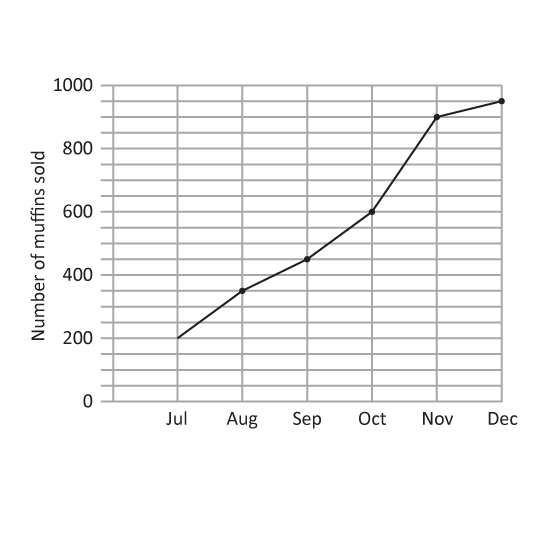
Level 3
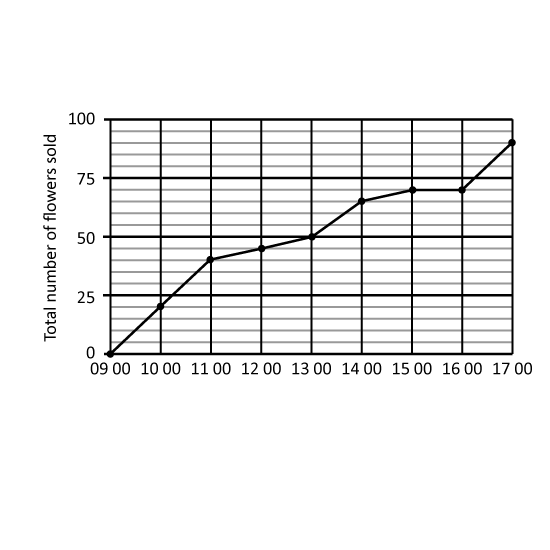
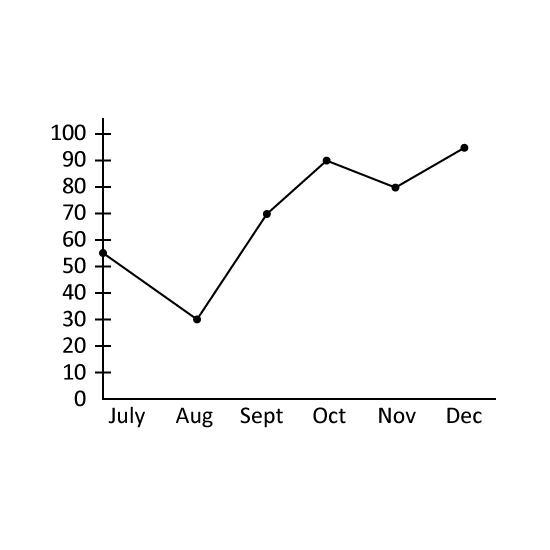
The line graph shows the number of dresses sold by a shop from July to December in 2013.
What was the average number of dresses sold per month from July to December in 2013?
The total number of dresses sold for the same period from July to December in 2012 was 672. Find the percentage decrease in the total number of dresses sold for the same period from 2012 to 2013.
Level 3
The line graph shows the number of dresses sold by a shop from July to December in 2013.
What was the average number of dresses sold per month from July to December in 2013?
The total number of dresses sold for the same period from July to December in 2012 was 672. Find the percentage decrease in the total number of dresses sold for the same period from 2012 to 2013.
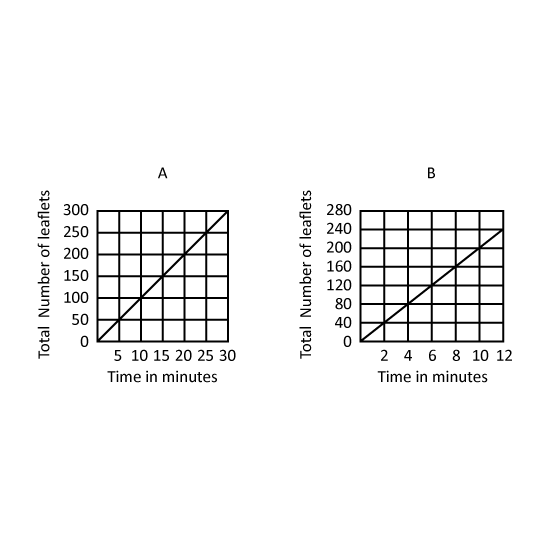
Level 3 PSLE
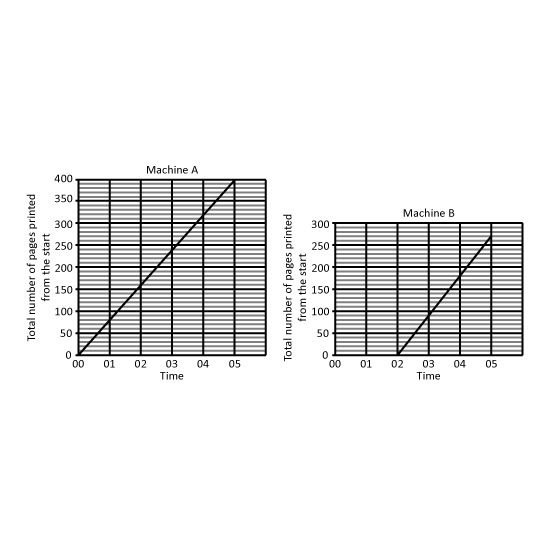
Mr Lee used two printers with different printing rates for a printing job. He started Machine A at 10 00 and started Machine B two minutes later.
He stopped both machines at 10 05.
The graphs show the total number of pages printed by each machine from the start of printing.
How many pages had been printed by Machine A at the time Mr Lee started Machine B?
What was the difference in the number of pages printed by the two machines from 10 00 to 10 05?
Which machine, A or B, has a faster printing rate? What is the difference in the number of pages printed by the machines in one minute? Give your answer in this format. (Eg A, 1)
Level 3 PSLE
Mr Lee used two printers with different printing rates for a printing job. He started Machine A at 10 00 and started Machine B two minutes later.
He stopped both machines at 10 05.
The graphs show the total number of pages printed by each machine from the start of printing.
How many pages had been printed by Machine A at the time Mr Lee started Machine B?
What was the difference in the number of pages printed by the two machines from 10 00 to 10 05?
Which machine, A or B, has a faster printing rate? What is the difference in the number of pages printed by the machines in one minute? Give your answer in this format. (Eg A, 1)
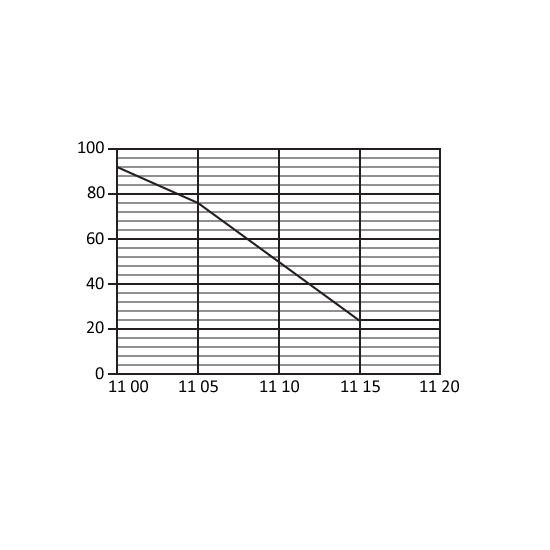
Level 3 PSLE Water could flow out of a tank through tap A and tap B. At first, Jim turned on tap A. After some time, he also turned on tap B so that more water flowed out. Later, he turned off both taps at the same time. The line graph shows the volume of water in the tank from 11 00 to 11 20.
What was the rate of flow of water from tap A in litres per minute?
How many litres of water flowed out of the tank throughout the period when both taps were turned on?
What was the rate of flow of water from tap B in litres per minute?