Level 3
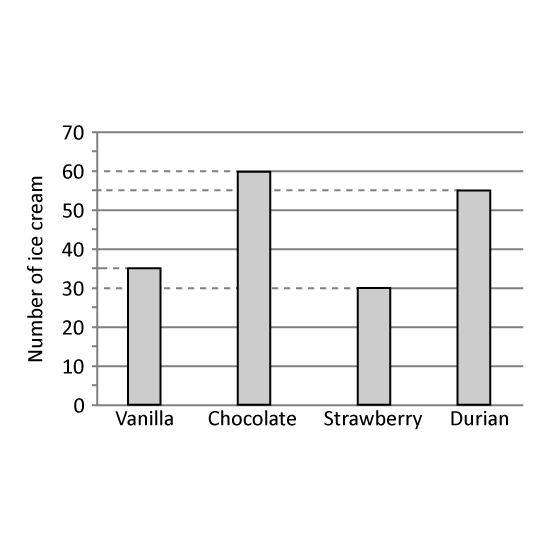
The bar graph shows the number of ice-cream flavours sold at a shop in a day.
What percentage of the ice-creams sold was durian ice-creams? Give your answer correct to 1 decimal place.
The cost of each ice-cream was the same. The amount of money collected for vanilla ice-creams was $15 more than the amount of money collected for strawberry ice-creams. What was the total amount of money collected from the sale of all the ice-creams?
Level 3
The bar graph shows the number of ice-cream flavours sold at a shop in a day.
What percentage of the ice-creams sold was durian ice-creams? Give your answer correct to 1 decimal place.
The cost of each ice-cream was the same. The amount of money collected for vanilla ice-creams was $15 more than the amount of money collected for strawberry ice-creams. What was the total amount of money collected from the sale of all the ice-creams?