Level 2 PSLE
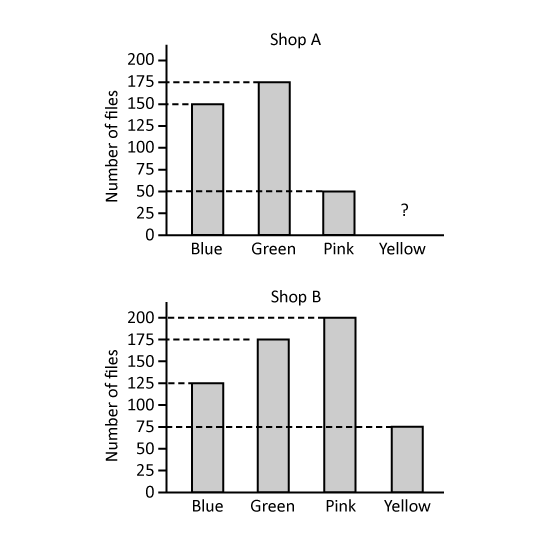
Shops A and B sell highlighters of four colours. The bar graphs show the number of highlighters sold by each shop in April.
The bar for the number yellow highlighters sold by Shop A has not been drawn.
Half of the highlighters sold by Shop A were yellow highlighters. How many yellow highlighters did Shop A sell?
Which colour(s) of highlighters did Shop A sell less than Shop B? (Give your answer(s) in letter(s) in alphabetical order. Eg Blue, Red = B, R
In May, Shop B sold 75 more blue highlighters than the number of blue highlighters sold in April. What was the percentage increase in the number of blue highlighters sold by Shop B from April to May?
Level 2 PSLE
Shops A and B sell highlighters of four colours. The bar graphs show the number of highlighters sold by each shop in April.
The bar for the number yellow highlighters sold by Shop A has not been drawn.
Half of the highlighters sold by Shop A were yellow highlighters. How many yellow highlighters did Shop A sell?
Which colour(s) of highlighters did Shop A sell less than Shop B? (Give your answer(s) in letter(s) in alphabetical order. Eg Blue, Red = B, R
In May, Shop B sold 75 more blue highlighters than the number of blue highlighters sold in April. What was the percentage increase in the number of blue highlighters sold by Shop B from April to May?
Level 3 PSLE
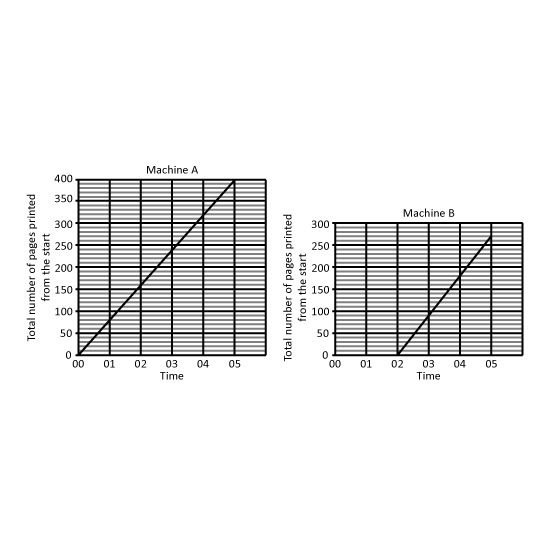
Mr Lee used two printers with different printing rates for a printing job. He started Machine A at 10 00 and started Machine B two minutes later.
He stopped both machines at 10 05.
The graphs show the total number of pages printed by each machine from the start of printing.
How many pages had been printed by Machine A at the time Mr Lee started Machine B?
What was the difference in the number of pages printed by the two machines from 10 00 to 10 05?
Which machine, A or B, has a faster printing rate? What is the difference in the number of pages printed by the machines in one minute? Give your answer in this format. (Eg A, 1)
Level 3 PSLE
Mr Lee used two printers with different printing rates for a printing job. He started Machine A at 10 00 and started Machine B two minutes later.
He stopped both machines at 10 05.
The graphs show the total number of pages printed by each machine from the start of printing.
How many pages had been printed by Machine A at the time Mr Lee started Machine B?
What was the difference in the number of pages printed by the two machines from 10 00 to 10 05?
Which machine, A or B, has a faster printing rate? What is the difference in the number of pages printed by the machines in one minute? Give your answer in this format. (Eg A, 1)
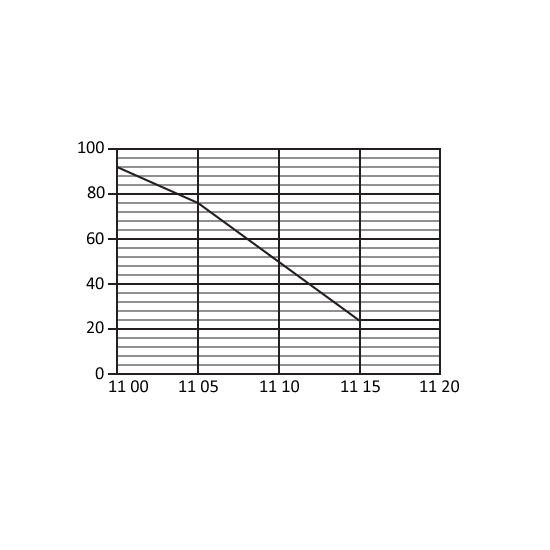
Level 3 PSLE Water could flow out of a tank through tap A and tap B. At first, Jim turned on tap A. After some time, he also turned on tap B so that more water flowed out. Later, he turned off both taps at the same time. The line graph shows the volume of water in the tank from 11 00 to 11 20.
What was the rate of flow of water from tap A in litres per minute?
How many litres of water flowed out of the tank throughout the period when both taps were turned on?
What was the rate of flow of water from tap B in litres per minute?