Level 3
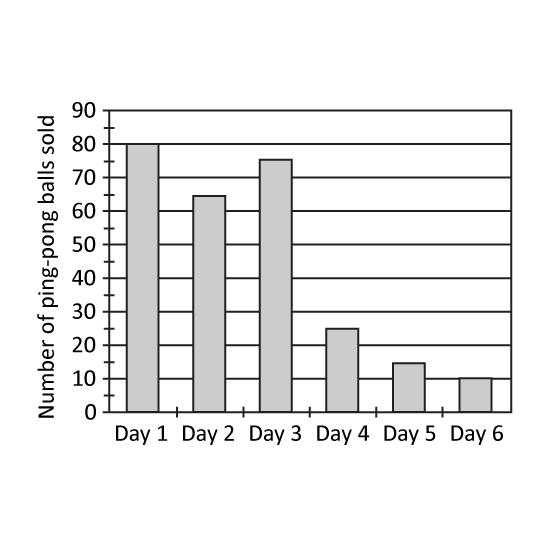
A sports shop had 300 ping-pong balls for sale. Each ping-pong ball is sold at $2. At the end of each day, the number of ping-pong balls was recorded in the bar graph shown.
What fraction of the total number of ping-pong balls was left at the end of Day 3? Express your answer in its simplest form.
If the shop decided to sell every 5 ping-pong balls at $9.30 from Day 4 onwards, how much less would it collect from the sale of the ping-pong balls?
Level 3
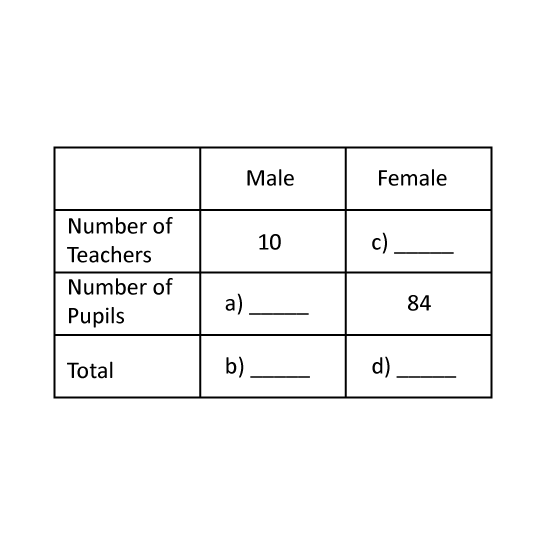
The table shows the number of teachers and pupils who went to Snow City. A total of 220 teachers and pupils went to Snow City. 198 of them are pupils. Complete the table.
Level 3
The table shows the number of teachers and pupils who went to Snow City. A total of 220 teachers and pupils went to Snow City. 198 of them are pupils. Complete the table.