Level 1 PSLE
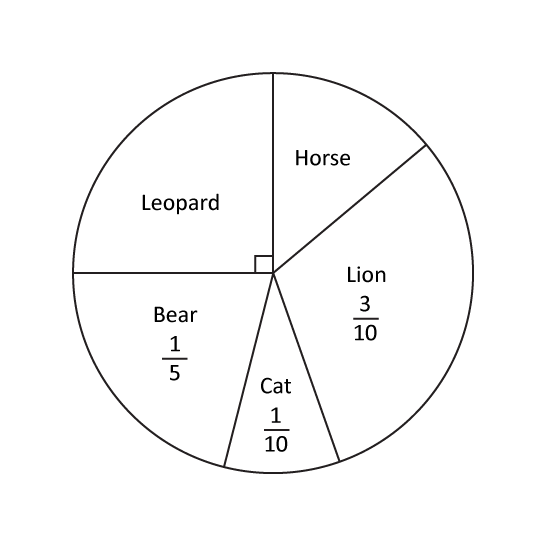
In a class, each pupil chose one animal for their class banner. The pie chart shows their choices. What fraction of the class chose Horse?
Level 1 PSLE
In a class, each pupil chose one animal for their class banner. The pie chart shows their choices. What fraction of the class chose Horse?
Level 2
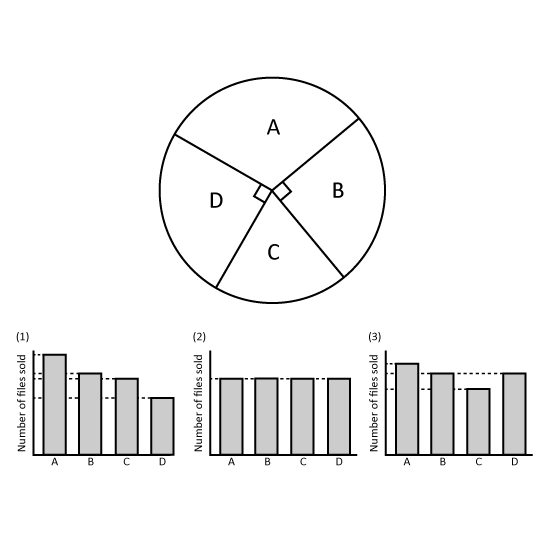
The pie chart shows the number of three types of files sold by a bookstore last week. Which bar graph best represents the information in the pie chart? Give your answer in number. (Eg 1)
Level 2
The pie chart shows the number of three types of files sold by a bookstore last week. Which bar graph best represents the information in the pie chart? Give your answer in number. (Eg 1)