Level 1
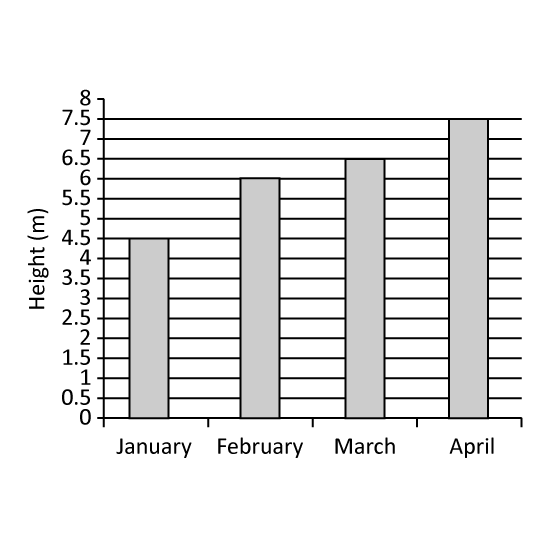
The graph shows the height of a plant on the last day of each month from January to April. In which month was the greatest increase in the plant's plant's height recorded?
Level 1
The graph shows the height of a plant on the last day of each month from January to April. In which month was the greatest increase in the plant's plant's height recorded?
Level 1
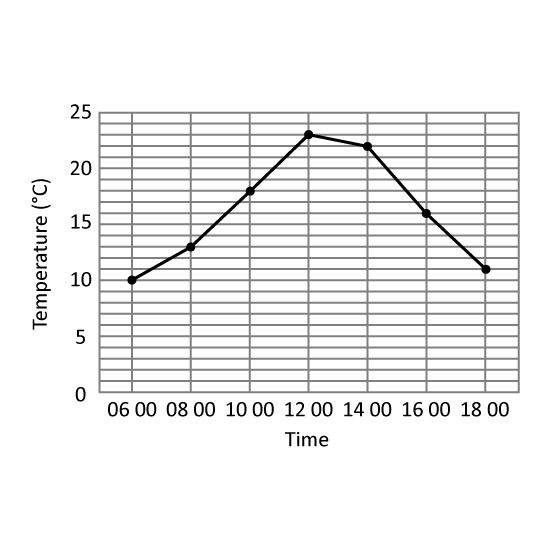
The table shows the temperature change in Hillview Town.
At which 2 hour-interval of the day was there the greatest change in temperature? Give your answer in this format. (Eg 1200 to 1400)
Level 1
The table shows the temperature change in Hillview Town.
At which 2 hour-interval of the day was there the greatest change in temperature? Give your answer in this format. (Eg 1200 to 1400)
Level 2
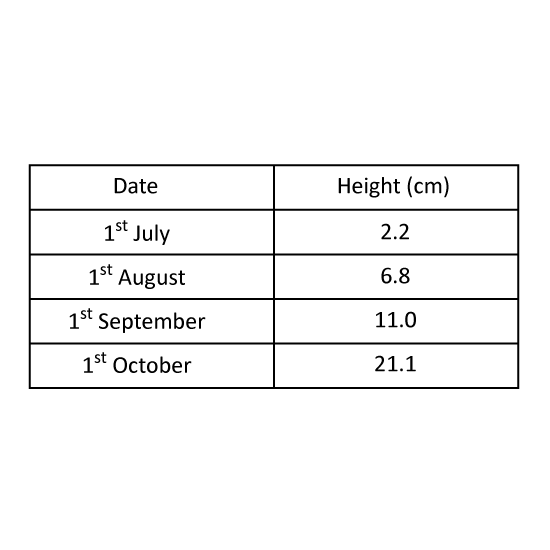
The table shows the height of a plant in centimetres on the first day of each month from July to October. In which month did the plant's height increase the most? Give your answer in this format. (Eg Jan)
Level 2
The table shows the height of a plant in centimetres on the first day of each month from July to October. In which month did the plant's height increase the most? Give your answer in this format. (Eg Jan)
Level 2
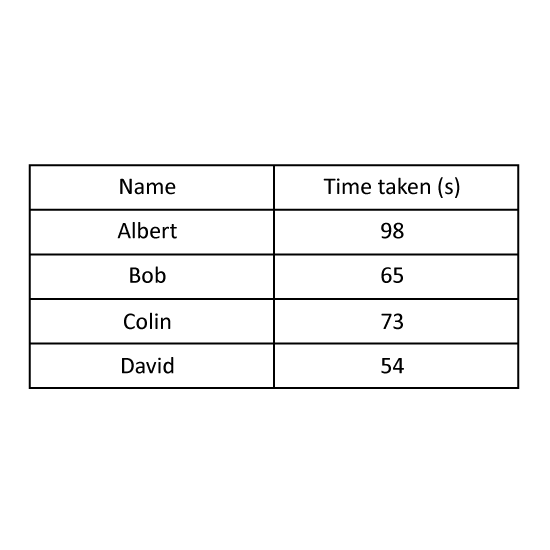
Four boys took part in a race. The table shows the time taken by the four boys.
How much faster was the fastest runner in the race compared to Bob? Give your answer in seconds.
Level 2
Four boys took part in a race. The table shows the time taken by the four boys.
How much faster was the fastest runner in the race compared to Bob? Give your answer in seconds.
Level 2
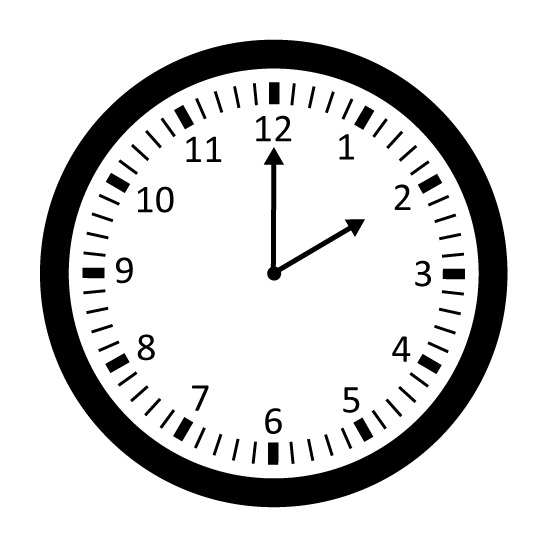
Look at the picture.
What is the time shown on the clock? Give the answer in number.
(1) Half past 4
(2) Half past 5
(3) 4 o'clock
(4) 5 o'clock
Level 2
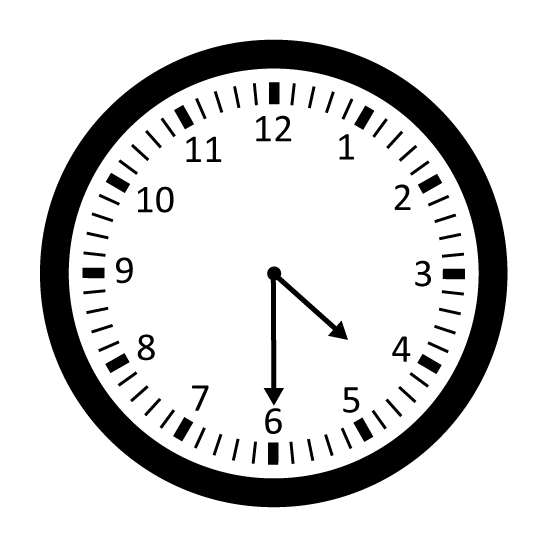
Look at the picture.
What is the time shown on the clock? Give the answer in number.
(1) Half past 4
(2) Half past 5
(3) 4 o'clock
(4) 5 o'clock