Level 1 PSLE
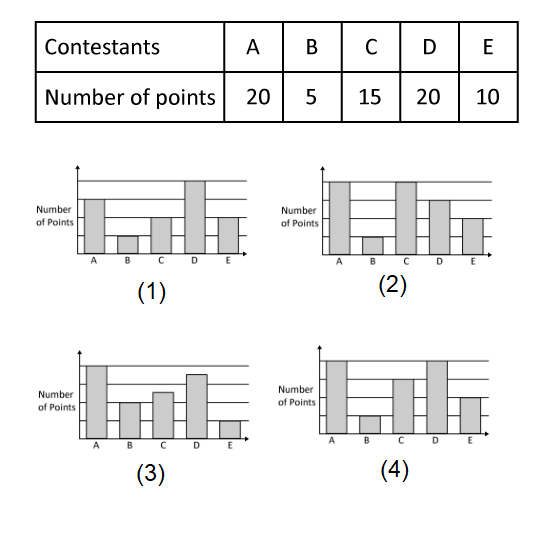
The table shows the points scored by 5 contestants in a game. Which of the following bar graphs represents the information shown in the table above?
Level 1 PSLE
The table shows the points scored by 5 contestants in a game. Which of the following bar graphs represents the information shown in the table above?
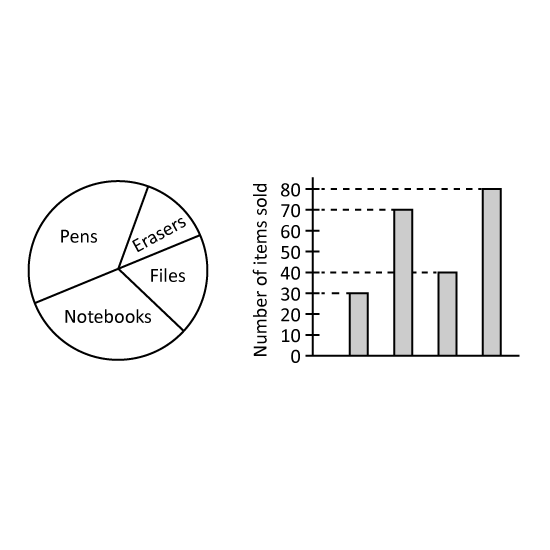
Level 2 PSLE The pie chart shows the number of pens, erasers, file and notebook sold by a shop. The same information is shown in a bar graph, but the names of the items are not shown on the bar graph.
How many less erasers than pens are sold?
Level 2 PSLE The pie chart shows the number of pens, erasers, file and notebook sold by a shop. The same information is shown in a bar graph, but the names of the items are not shown on the bar graph.
How many less erasers than pens are sold?
Level 2
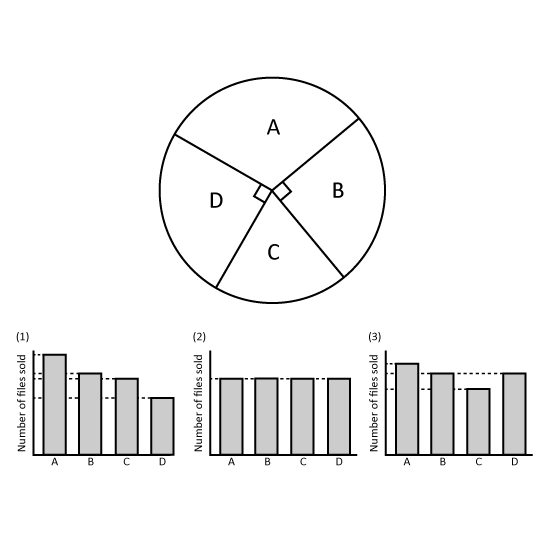
The pie chart shows the number of three types of files sold by a bookstore last week. Which bar graph best represents the information in the pie chart? Give your answer in number. (Eg 1)
Level 2
The pie chart shows the number of three types of files sold by a bookstore last week. Which bar graph best represents the information in the pie chart? Give your answer in number. (Eg 1)
Level 1 PSLE
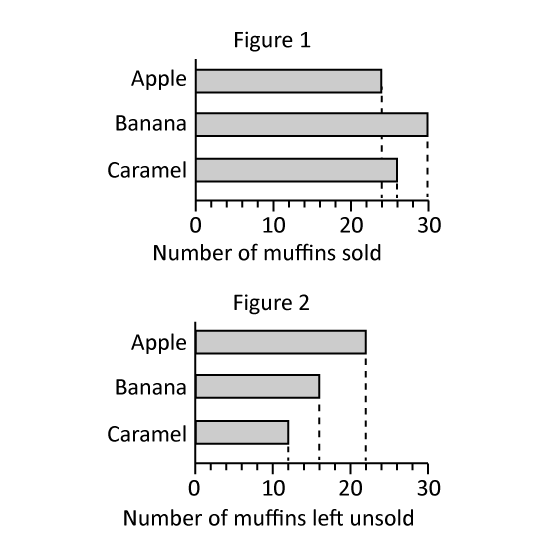
Jen baked some muffins to sell at a funfair. Figure 1 shows the number of muffins that was sold. Figure 2 shows the number of muffins left unsold at the end of the funfair.
What was the number of caramel muffins Jen baked?
Altogether, how many apples and banana muffins were left unsold after the funfair?
Level 1 PSLE
Jen baked some muffins to sell at a funfair. Figure 1 shows the number of muffins that was sold. Figure 2 shows the number of muffins left unsold at the end of the funfair.
What was the number of caramel muffins Jen baked?
Altogether, how many apples and banana muffins were left unsold after the funfair?