Level 1
The graph shows the number of sports that a group of pupils participated in. How many pupils participated in at least 1 sport?
1 m
Level 1
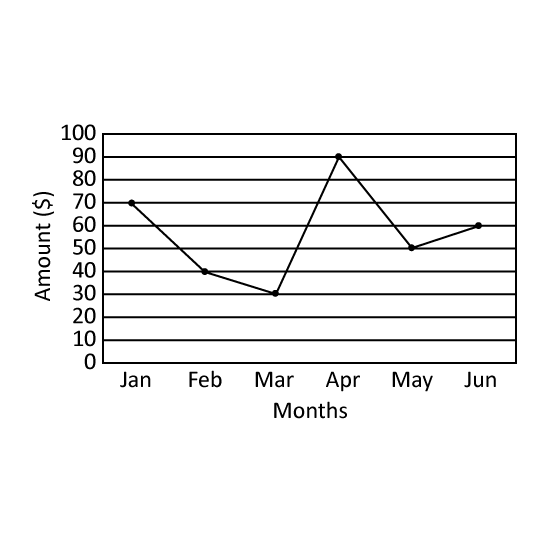
The line graph shows the amount of utility bills paid by Mr Gann's household in the first six months of the year. In which month did the greatest decrease in utility bills occur? Give the answer in short form. (Eg Jan)
1 m
Level 3
The line graph shows the distance a driver was from his destination which was 60 km away over a period of time.
  1. How long did he take to reach his destination?
  2. At 10 00, how far had he travelled?
  3. How far did the driver drive during the period of his fastest speed?
3 m
Level 3
The graph shows the number of muffins sold each month by a bakery from July to December in 2015.
  1. In which month were the least muffins sold? Express the month in short form. Eg Jan
  2. What was the total number of muffins sold in the last 3 months of the year?
3 m
Level 3
The bookshop sells 4 different coloured pens. The line graph shows the number of pens sold for each colour in a week.
  1. What was the difference between the number of blue and black pens sold?
  2. Each red pen cost $0.30 more than each green pen. The bookshop collected $84 from selling the green pens. What was the price of 1 red pen?
3 m