Level 1 PSLE
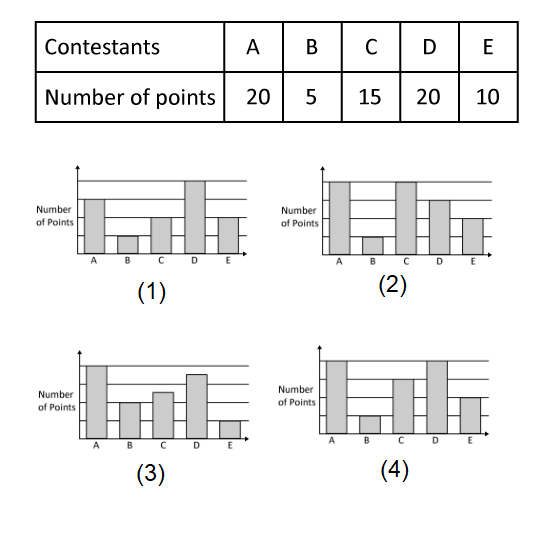
The table shows the points scored by 5 contestants in a game. Which of the following bar graphs represents the information shown in the table above?
Level 1 PSLE
The table shows the points scored by 5 contestants in a game. Which of the following bar graphs represents the information shown in the table above?
Level 2 PSLE
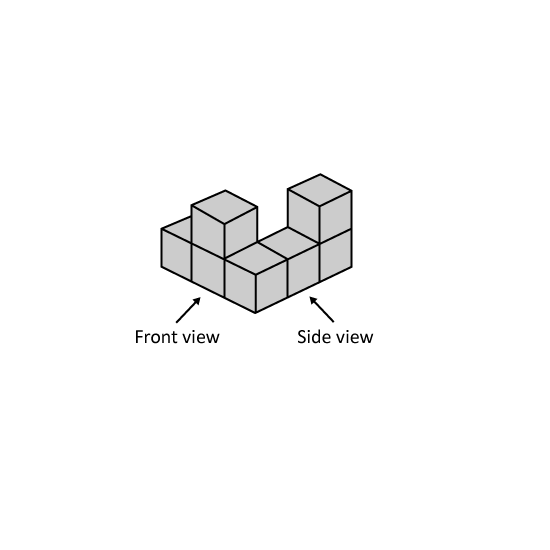
Amy builds a solid using 7 unit cubes. Find the greatest number of unit cubes Amy can add to the solid without changing the front view and side view.
Level 2 PSLE
Amy builds a solid using 7 unit cubes. Find the greatest number of unit cubes Amy can add to the solid without changing the front view and side view.
Level 1 PSLE
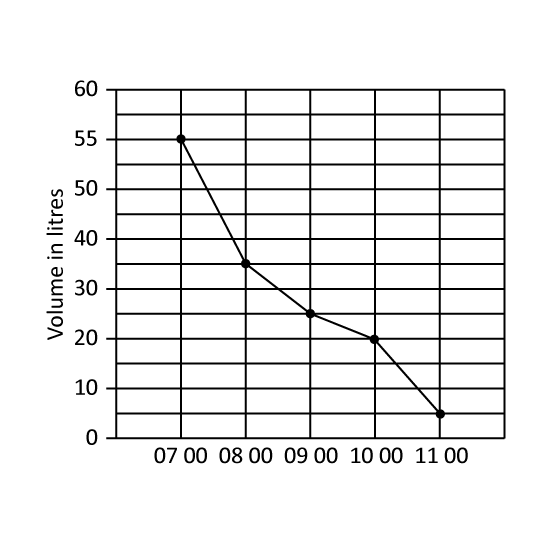
A tank was filled with 55 litre of water at 07 00. Water flowed out of the tank from 07 00 to 11 00. The line graph shows the amount of water in the tank from 07 00 to 11 00.
During which one-hour period was the decrease in the volume of water the greatest?
Give your answer in number. (Eg 1)
(1) From 0700 to 0800
(2) From 0700 to 0900
(3) From 0900 to 1000
(4) From 1000 to 1100
Level 1 PSLE
A tank was filled with 55 litre of water at 07 00. Water flowed out of the tank from 07 00 to 11 00. The line graph shows the amount of water in the tank from 07 00 to 11 00.
During which one-hour period was the decrease in the volume of water the greatest?
Give your answer in number. (Eg 1)
(1) From 0700 to 0800
(2) From 0700 to 0900
(3) From 0900 to 1000
(4) From 1000 to 1100