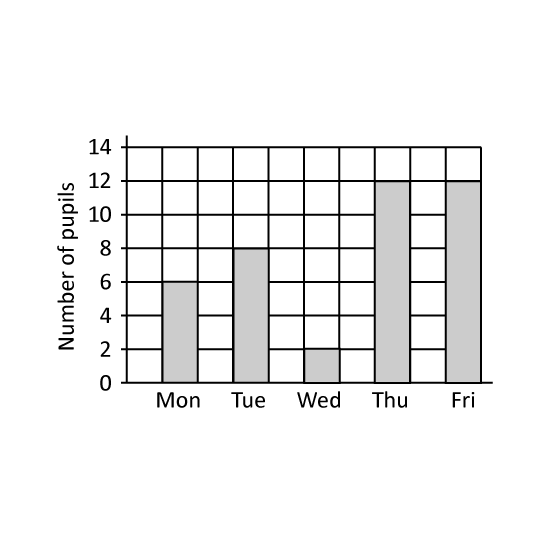
Level 1
The graph shows the number of students who visited the library in a week. On which day was the library visited by the least number of students? Give the answer in short form. (Eg Mon)
Level 1
The graph shows the number of students who visited the library in a week. On which day was the library visited by the least number of students? Give the answer in short form. (Eg Mon)
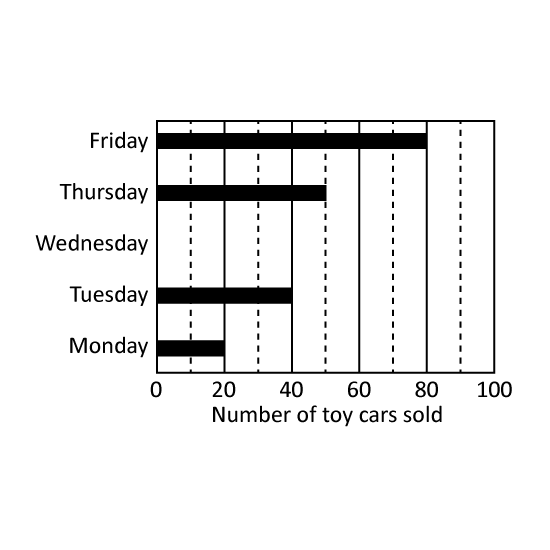
Level 2
The graph shows the number of visitors to the museum. On which days were there twice as many visitors as on Monday? Give the answer in short form. (Eg Mon)
Level 2
The graph shows the number of visitors to the museum. On which days were there twice as many visitors as on Monday? Give the answer in short form. (Eg Mon)
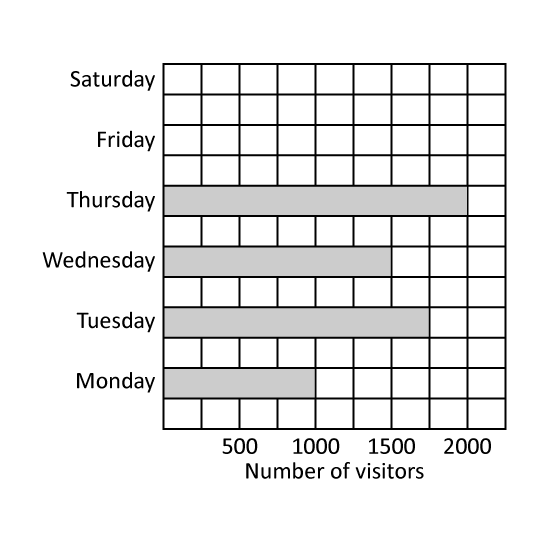
Level 2
The graph shows the number of visitors to the amusement park. 2 times as many visitors visited the amusement park on Friday as on Monday. How many visitors visited the amusement park on Friday?
Level 2
The graph shows the number of visitors to the amusement park. 2 times as many visitors visited the amusement park on Friday as on Monday. How many visitors visited the amusement park on Friday?