Level 2 PSLE
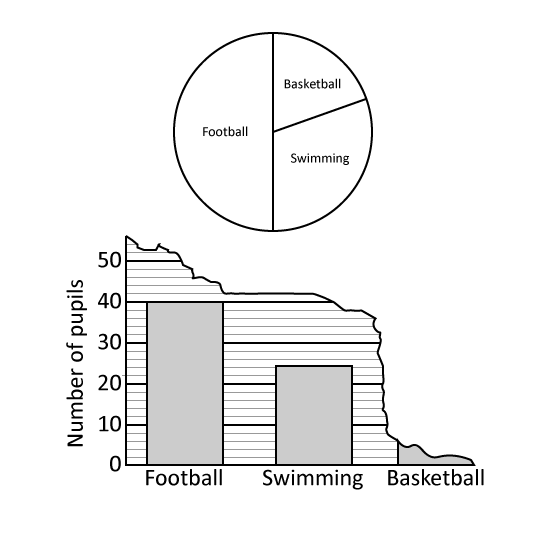
A group of boys were asked to choose their favourite sport from swimming, basketball and football. The pie chart represents the boys choices. Half of the group chose football.
What percentage of the group chose swimming?
The boys' choices were also represented by a bar graph. Part of the graph had been torn off. How many boys chose basketball?
Level 2 PSLE
A group of boys were asked to choose their favourite sport from swimming, basketball and football. The pie chart represents the boys choices. Half of the group chose football.
What percentage of the group chose swimming?
The boys' choices were also represented by a bar graph. Part of the graph had been torn off. How many boys chose basketball?
Level 1 PSLE
The pie chart represents the number of stationery sold by a shopkeeper. An equal number of markers and staplers were sold. What percentage of the stalks of flowers sold were markers?
Level 1 PSLE
The pie chart represents the number of stationery sold by a shopkeeper. An equal number of markers and staplers were sold. What percentage of the stalks of flowers sold were markers?
Level 1 PSLE
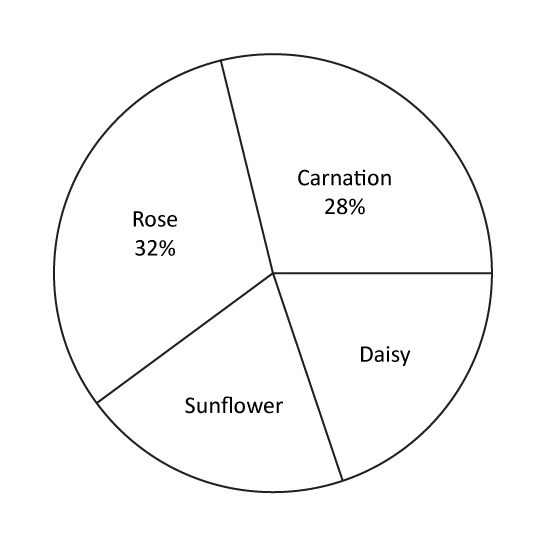
The pie chart represents the number of stalks of each type of flowers sold by a florist. An equal number of stalks of sunflowers and daisies were sold. The florist sold 6 more stalks of roses than carnations. What was the total number of stalks of flowers sold?
Level 1 PSLE
The pie chart represents the number of stalks of each type of flowers sold by a florist. An equal number of stalks of sunflowers and daisies were sold. The florist sold 6 more stalks of roses than carnations. What was the total number of stalks of flowers sold?
Level 2 PSLE
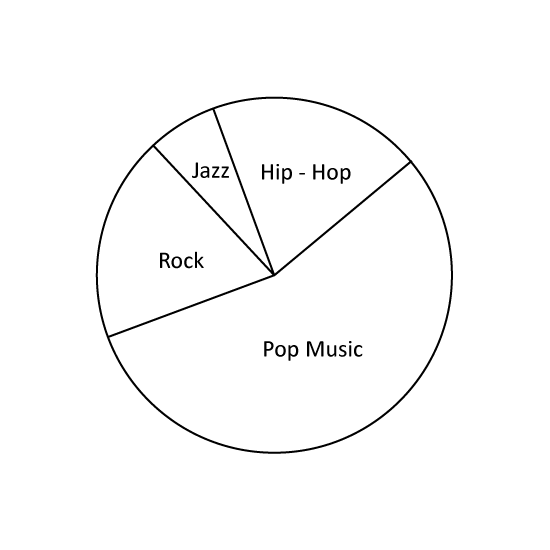
The pie chart shows the different genres of CDs at a stall. 15 of the CDs were Hip-Hop and 14 of the CDs were either Rock or Jazz. There were 3 times as many Rock CDs as Jazz CDs. What fraction of the CDs were Rock CDs?
Level 2 PSLE
The pie chart shows the different genres of CDs at a stall. 15 of the CDs were Hip-Hop and 14 of the CDs were either Rock or Jazz. There were 3 times as many Rock CDs as Jazz CDs. What fraction of the CDs were Rock CDs?
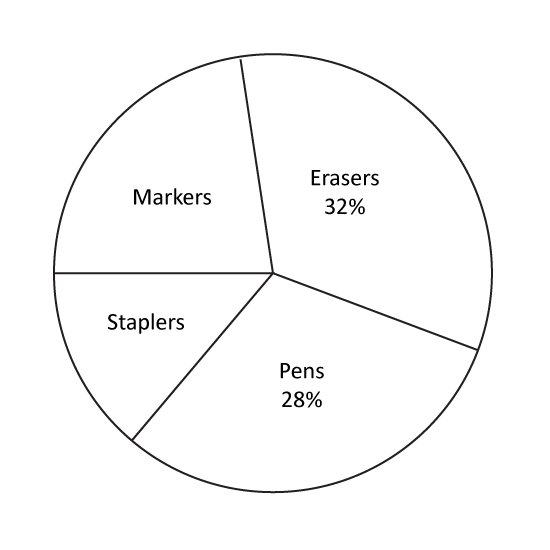
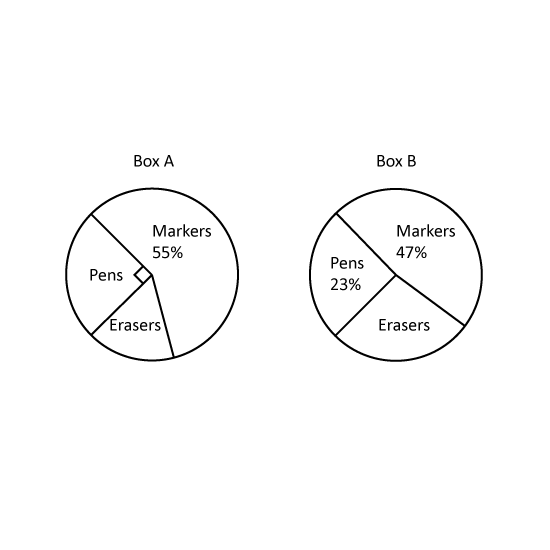
Level 2 The pie charts show the number of each type of stationery items in boxes, A and B. The total number of stationery items in Box A is twice the total number of stationery items in Box B.
Find the percentage of erasers in Box A.
What fraction of stationery items in Box B is erasers?
The number of erasers in Box A is 40. Find the number of erasers in Box B.