Level 2
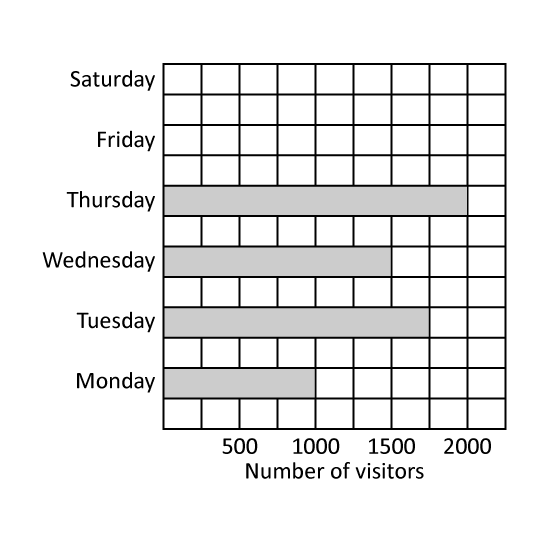
The graph shows the number of visitors to the amusement park. 2 times as many visitors visited the amusement park on Friday as on Monday. How many visitors visited the amusement park on Friday?
2 m
Level 2
The bar graph shows the number of newspapers sold over a period of 5 days.
  1. On which day was the least number of newspapers sold?
  2. How many more newspapers were sold on Sunday than on Friday?
2 m
Level 2
The bar graph shows the number of visitors at the different games stations at a carnival.
  1. Which games station has only half the number of visitors as the 'haunted house'
  2. How many visitors were at the 'Bouncing Castle' and 'Balloon Sculpting' altogether?
2 m
Level 2
The bar graph shows the number of books Primary 3 students read over a week.
  1. Class __ and ___ read 240 books in total.
  2. For every 3 books read by the students, they can exchange for 1 gift. How many more gifts did Class 3B exchange than Class 3C?
2 m
Level 1
The graph shows the number of books borrowed by 40 pupils in a class. How many pupils borrowed 4 storybooks?
2 m