Level 2
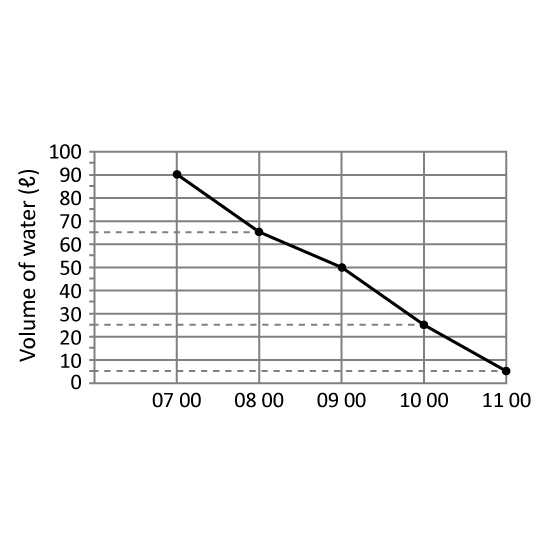
A tank was filled with 90 ℓ of water at 07 00. Water flowed out of the tank from 07 00 to 11 00. The line graph shows the amount of water in the tank from 07 00 to 11 00. Which one-hour period shows the least decrease in the amount of water in the tank? Give your answer in this format. (Eg 12 00 to 13 00)
Level 2
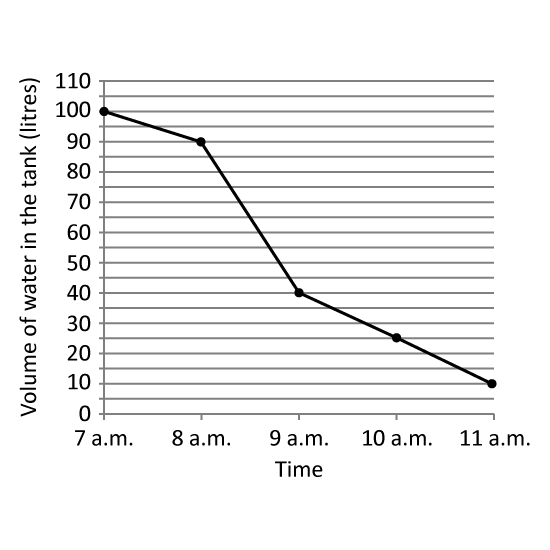
A tank was completely filled with water at 7 a.m Water flowed out of the tank from 7 a.m. to 11 a.m. The line graph shows the volume of water in the tank at each 1-hour interval from 7 a.m. to 11 a.m. At what time was 14 of the tank filled with water?
Level 2
A tank was completely filled with water at 7 a.m Water flowed out of the tank from 7 a.m. to 11 a.m. The line graph shows the volume of water in the tank at each 1-hour interval from 7 a.m. to 11 a.m. At what time was 14 of the tank filled with water?