Level 1
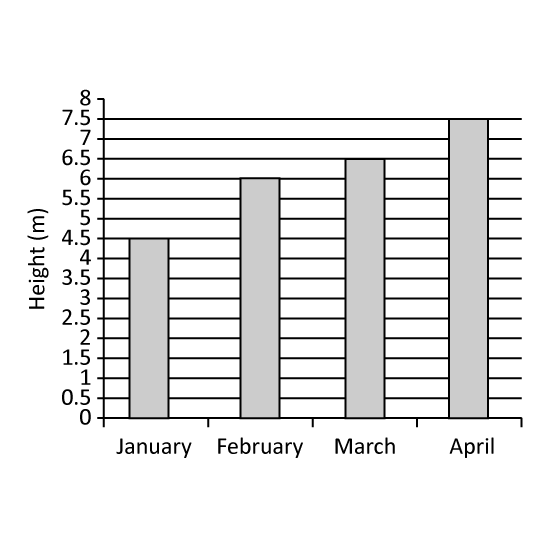
The graph shows the height of a plant on the last day of each month from January to April. In which month was the greatest increase in the plant's plant's height recorded?
Level 1
The graph shows the height of a plant on the last day of each month from January to April. In which month was the greatest increase in the plant's plant's height recorded?
Image in this question is not available.
Level 1
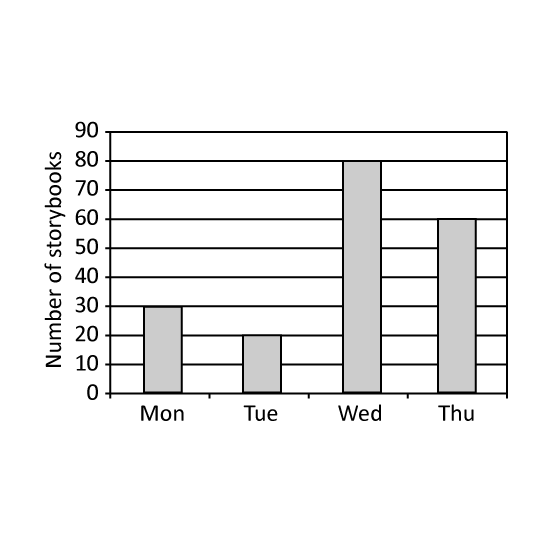
The graph shows the number of story books borrowed from a library over 4 days. What is the total number of story books borrowed from Monday to Thursday?
Level 1
The graph shows the number of story books borrowed from a library over 4 days. What is the total number of story books borrowed from Monday to Thursday?
Image in this question is not available.
Level 1
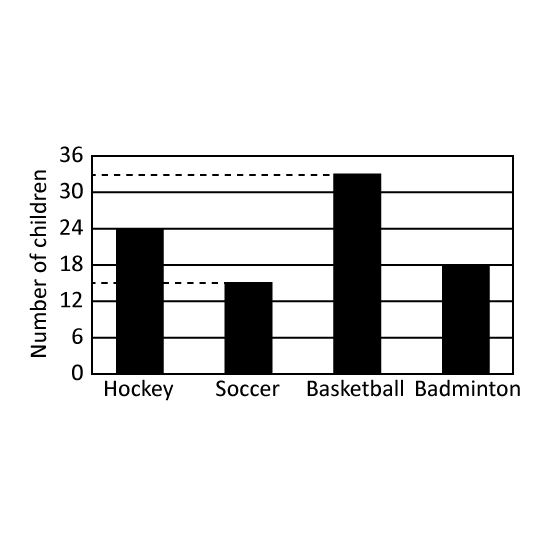
The graph shows the types of sports that children play in a primary school. What percentage of the children play badminton?
Level 1
The graph shows the types of sports that children play in a primary school. What percentage of the children play badminton?
Image in this question is not available.
Level 1
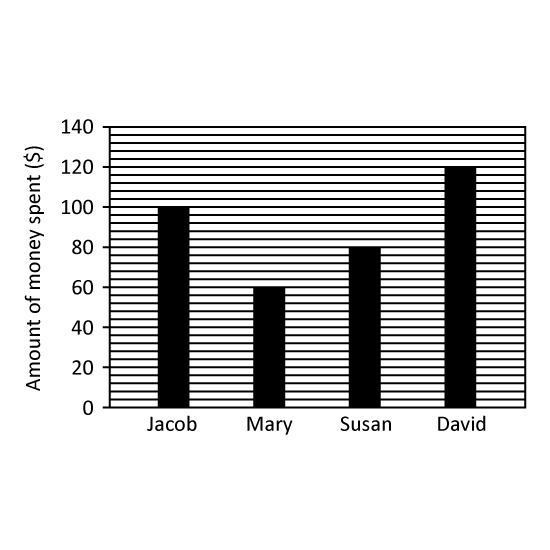
The bar graph shows the amount of money spent by 4 children.
Name the child/children who spent more than $80? Give your answer(s) in number(s). (Eg 1 or 1,2)
Level 1
The bar graph shows the amount of money spent by 4 children.
Name the child/children who spent more than $80? Give your answer(s) in number(s). (Eg 1 or 1,2)
Image in this question is not available.
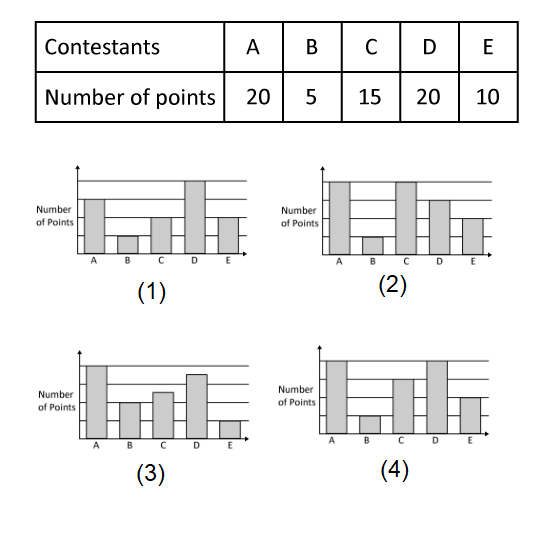
Level 1 PSLE
The table shows the points scored by 5 contestants in a game. Which of the following bar graphs represents the information shown in the table above?
Level 1 PSLE
The table shows the points scored by 5 contestants in a game. Which of the following bar graphs represents the information shown in the table above?
Image in this question is not available.
Level 2 PSLE
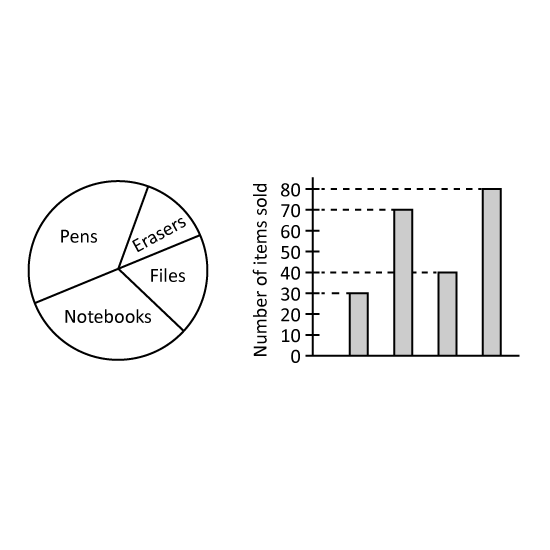
The pie chart shows the number of pens, erasers, file and notebook sold by a shop. The same information is shown in a bar graph, but the names of the items are not shown on the bar graph.
How many less erasers than pens are sold?
Level 2 PSLE
The pie chart shows the number of pens, erasers, file and notebook sold by a shop. The same information is shown in a bar graph, but the names of the items are not shown on the bar graph.
How many less erasers than pens are sold?
Image in this question is not available.
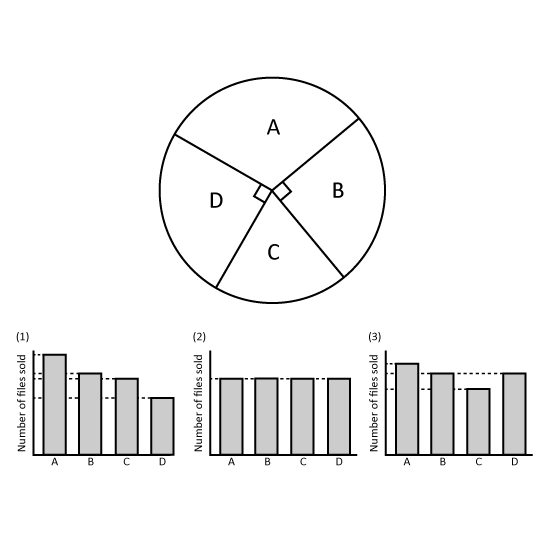
Level 2
The pie chart shows the number of three types of files sold by a bookstore last week. Which bar graph best represents the information in the pie chart? Give your answer in number. (Eg 1)
Level 2
The pie chart shows the number of three types of files sold by a bookstore last week. Which bar graph best represents the information in the pie chart? Give your answer in number. (Eg 1)
Image in this question is not available.
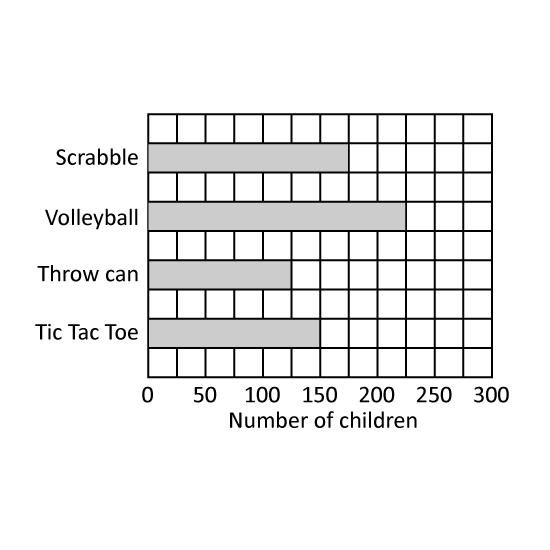
Level 1
Which game has 125 fans? Write the answer in letter. (Eg A)
(A) Scrabble
(B) Volleyball
(C) Throw Can
(D) Tic Tac Toe
Level 1
Which game has 125 fans? Write the answer in letter. (Eg A)
(A) Scrabble
(B) Volleyball
(C) Throw Can
(D) Tic Tac Toe
Image in this question is not available.
Level 1
The graph shows the favorite sports of children.
(A) Scrabble
(B) Volleyball
(C) Throw Can
(D) Tic Tac Toe
Which sport is the (a) most popular and the (b) least popular? Write the answer in letter. (Eg A)
Level 1
The graph shows the favorite sports of children.
(A) Scrabble
(B) Volleyball
(C) Throw Can
(D) Tic Tac Toe
Which sport is the (a) most popular and the (b) least popular? Write the answer in letter. (Eg A)
Image in this question is not available.
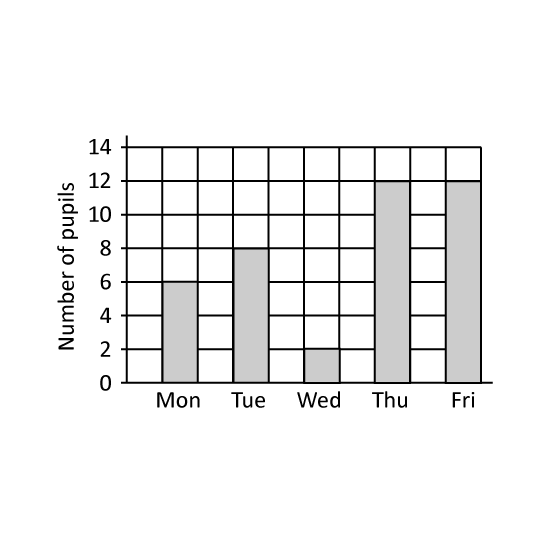
Level 1
On which two days did an equal number of students visited the library? Give the answers in short form. (Eg Mon, Thu)
Level 1
On which two days did an equal number of students visited the library? Give the answers in short form. (Eg Mon, Thu)
Image in this question is not available.
Level 1
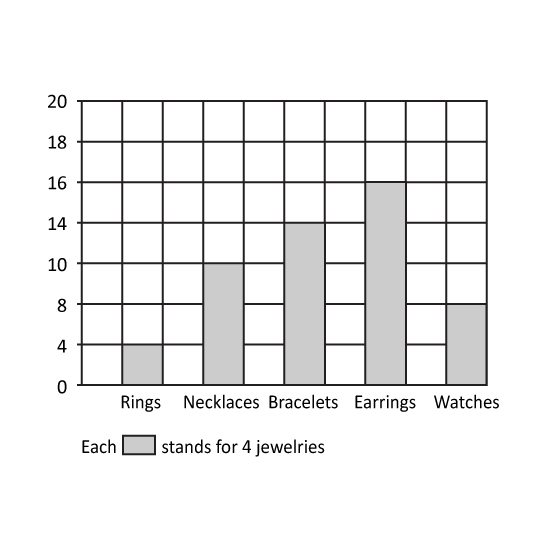
Jenny recorded the number of jewelry at the jewelry shop in the graph as shown. How many necklaces are there?
Level 1
Jenny recorded the number of jewelry at the jewelry shop in the graph as shown. How many necklaces are there?
Image in this question is not available.
Level 1
The graph shows the number of students who visited the library in a week. On which day was the library visited by the least number of students? Give the answer in short form. (Eg Mon)
Level 1
The graph shows the number of students who visited the library in a week. On which day was the library visited by the least number of students? Give the answer in short form. (Eg Mon)
Image in this question is not available.
Level 2
Which 2 games have a total number of 300 fans? Write the answer in letter. (Eg A, B)
(A) Scrabble
(B) Volleyball
(C) Throw Can
(D) Tic Tac Toe
Level 2
Which 2 games have a total number of 300 fans? Write the answer in letter. (Eg A, B)
(A) Scrabble
(B) Volleyball
(C) Throw Can
(D) Tic Tac Toe
Image in this question is not available.
Level 2
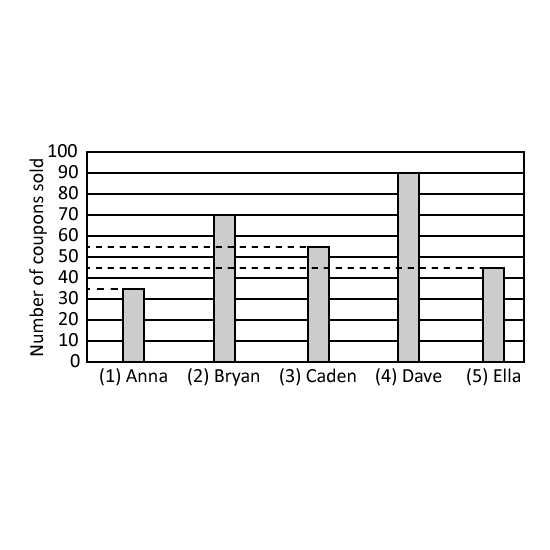
The bar graph shows the number of coupons sold by five children to raise funds for charity.
Which two boys sold the same number of coupons as David?
Level 2
The bar graph shows the number of coupons sold by five children to raise funds for charity.
Which two boys sold the same number of coupons as David?
Image in this question is not available.
Level 2
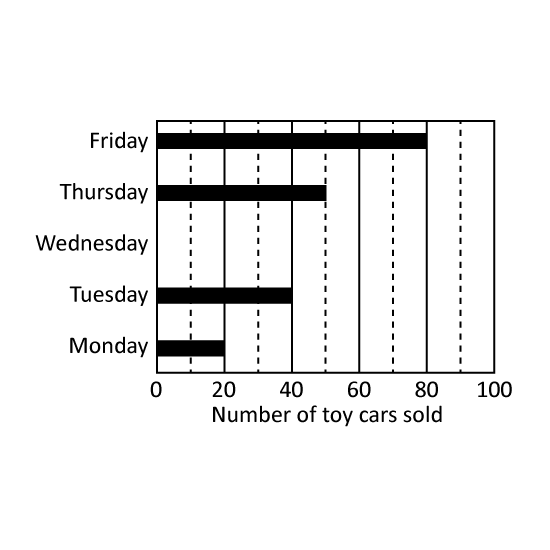
The graph shows the number of toy cars sold in 5 days. Study the graph carefully and use it to answer the following questions.
- 380 cars were sold from Monday to Friday. How many toy cars were sold on Wednesday?
- The number of toy cars sold on Sunday was twice the number sold on Thursday. How many toy cars were sold on Sunday?
Level 2
The graph shows the number of toy cars sold in 5 days. Study the graph carefully and use it to answer the following questions.
- 380 cars were sold from Monday to Friday. How many toy cars were sold on Wednesday?
- The number of toy cars sold on Sunday was twice the number sold on Thursday. How many toy cars were sold on Sunday?
Image in this question is not available.
Level 2
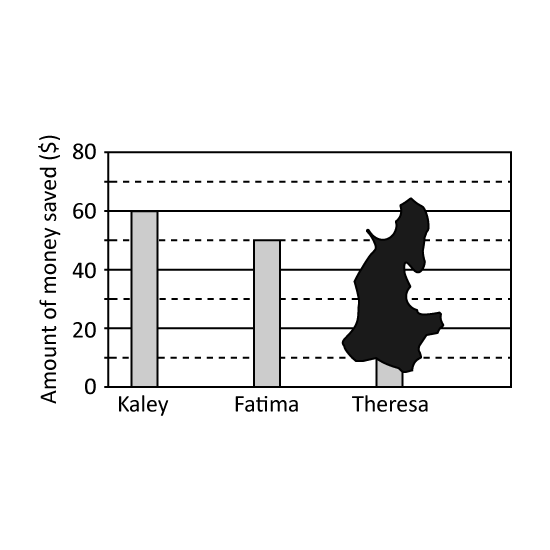
The bar graph shows the amount of money saved by 3 children in Jun.
Part of the graph had been blotted with ink. The total amount saved by the 3 children in June was $145.
- Who saved more money, Fatima or Theresa? Give your answer in number. (Eg 1)
- How much more did this child save?
Level 2
The bar graph shows the amount of money saved by 3 children in Jun.
Part of the graph had been blotted with ink. The total amount saved by the 3 children in June was $145.
- Who saved more money, Fatima or Theresa? Give your answer in number. (Eg 1)
- How much more did this child save?
Image in this question is not available.
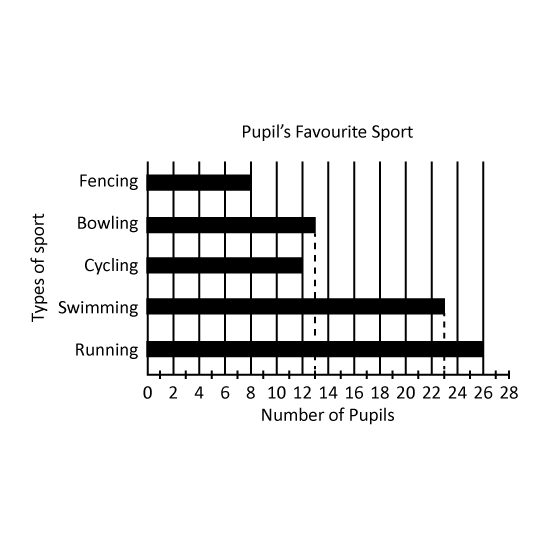
Level 2
The bar graph shows the types of sport that a group of pupils like. Which sport has twice as many pupils as Bowling?
Level 2
The bar graph shows the types of sport that a group of pupils like. Which sport has twice as many pupils as Bowling?
Image in this question is not available.
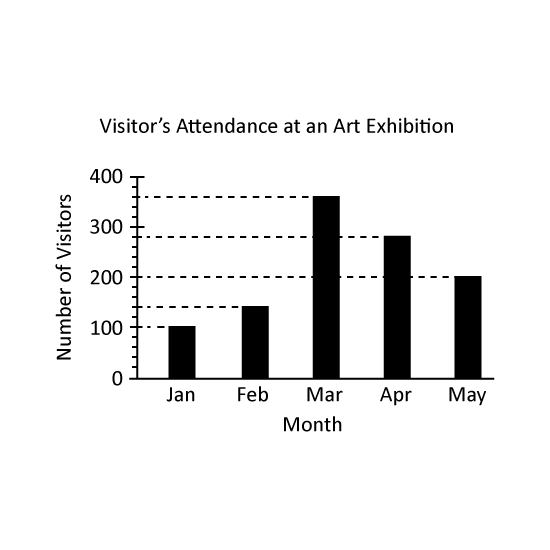
Level 2
The graph shows the number of visitors who attended an art exhibition over five months. Which month has twice the number of visitors in January? Give your answer in this format. (Eg Jan)
Level 2
The graph shows the number of visitors who attended an art exhibition over five months. Which month has twice the number of visitors in January? Give your answer in this format. (Eg Jan)
Image in this question is not available.
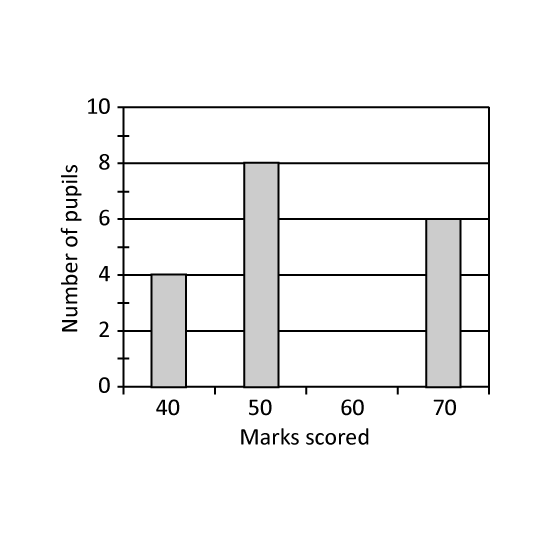
Level 2
The bar graph shows the exam results of a group of pupils. How many pupils who scored 60 marks, given that 12 of the pupils scored 50 marks and below.
Level 2
The bar graph shows the exam results of a group of pupils. How many pupils who scored 60 marks, given that 12 of the pupils scored 50 marks and below.
Image in this question is not available.
Level 2
The graph shows the number of visitors to the museum. On which days were there twice as many visitors as on Monday? Give the answer in short form. (Eg Mon)
Level 2
The graph shows the number of visitors to the museum. On which days were there twice as many visitors as on Monday? Give the answer in short form. (Eg Mon)
Image in this question is not available.