Level 1 PSLE
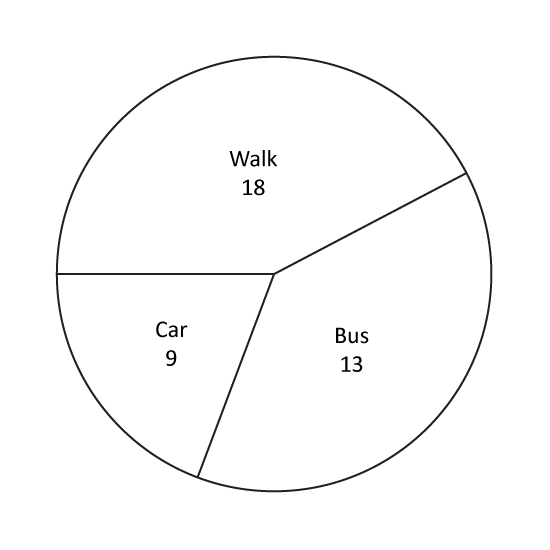
A group of 200 pupils was asked to name their favourite sports. The pie chart shows their choices and the number of pupils who chose each of the sports. Which sports was chosen by 25% of the pupils? Give the answer in letter.
Level 1 PSLE
A group of 200 pupils was asked to name their favourite sports. The pie chart shows their choices and the number of pupils who chose each of the sports. Which sports was chosen by 25% of the pupils? Give the answer in letter.
Level 2 PSLE A box contained black balls and green balls. 40% of the balls were green. After some red balls were added to the box, 28% of the balls were green. What percentage of the balls in the box were red?
Level 2
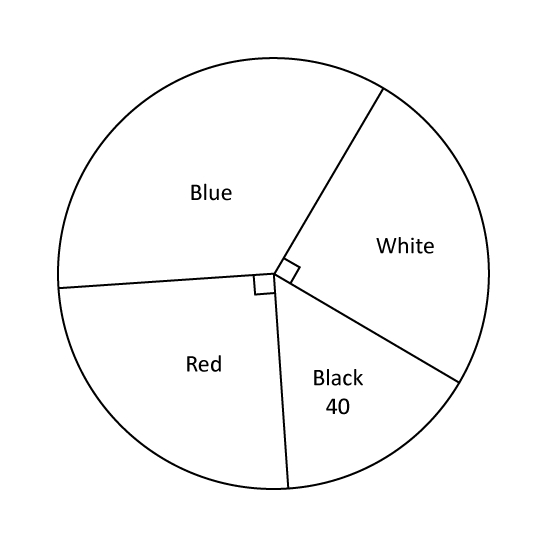
In a box, 40% of the pens are red pens and the rest are blue and black pens. The number of black pens is twice the number of blue pens. What percentage of the pens in the box are blue pens?
Level 2 PSLE
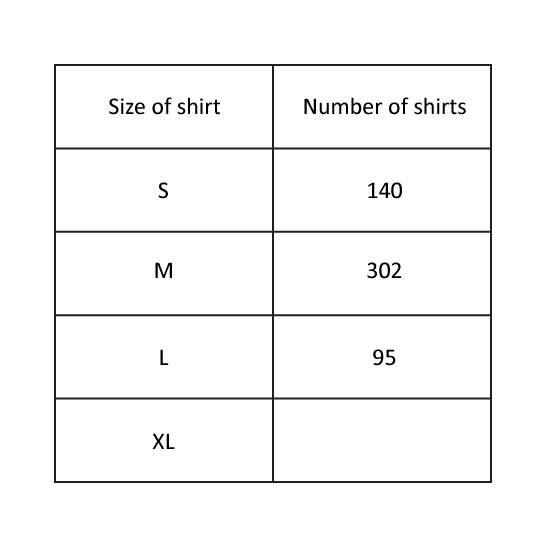
A shop sells shirts in four different sizes. The table shows the number of T-shirts sold in June for size S, M and L but not XL.
50% of the shirts sold were in size M. How many of the shirts sold were in size XL?
In July the number of shirts sold in size XL remained the same but there
was an increase in the number of shirts sold in the other sizes. Did the percentage of the shirts sold in size XL (1) increase, (2) decrease or (3) remain the same from June to July? Give the answer in number. (Eg 1)
Level 2 PSLE
A shop sells shirts in four different sizes. The table shows the number of T-shirts sold in June for size S, M and L but not XL.
50% of the shirts sold were in size M. How many of the shirts sold were in size XL?
In July the number of shirts sold in size XL remained the same but there
was an increase in the number of shirts sold in the other sizes. Did the percentage of the shirts sold in size XL (1) increase, (2) decrease or (3) remain the same from June to July? Give the answer in number. (Eg 1)
Level 2
2% of the people who signed up for their driving test were absent. Of those present, 57 passed the test. The rest failed. What percentage of the total number of people who signed up failed the test?
Level 2
At a stadium, there were 40 children from Club W and 10% more children from Club X. Some children from Club X left and the ratio of the number of children from Club W to the number of children from Club X became 5 : 2. How many children from Club X left?
Level 2
There was an equal number of boys and girls in the hall. When 10% of the girls left the hall, there were 5 more boys than girls remaining in the hall. How many children remained in the hall?
Level 2
At a swimming pool, 30% of the people are men, 25% are women and the rest are children. If there are 160 people in the swimming pool, how many of them are children?
Level 2
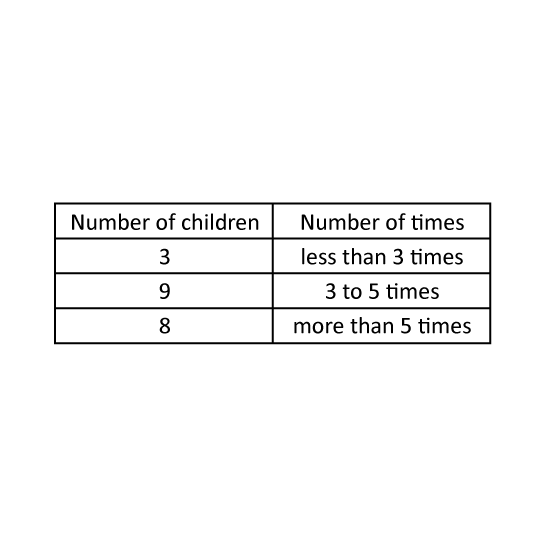
The table shows the number of times a group of children who participated in sports in June. What percentage of the children played sports more than 5 times in June?
Level 2
The table shows the number of times a group of children who participated in sports in June. What percentage of the children played sports more than 5 times in June?
Level 2
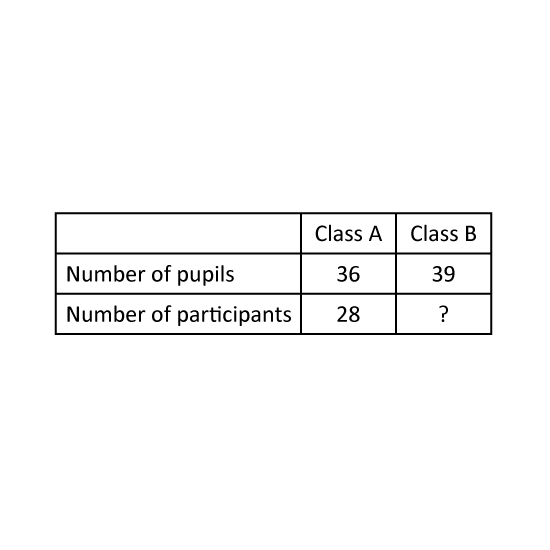
The table shows the number of pupils who participated in an English quiz from two classes. Given that the overall participation percentage is 80% for the two classes, how many pupils from Class B participated in the English quiz?
Level 2
The table shows the number of pupils who participated in an English quiz from two classes. Given that the overall participation percentage is 80% for the two classes, how many pupils from Class B participated in the English quiz?
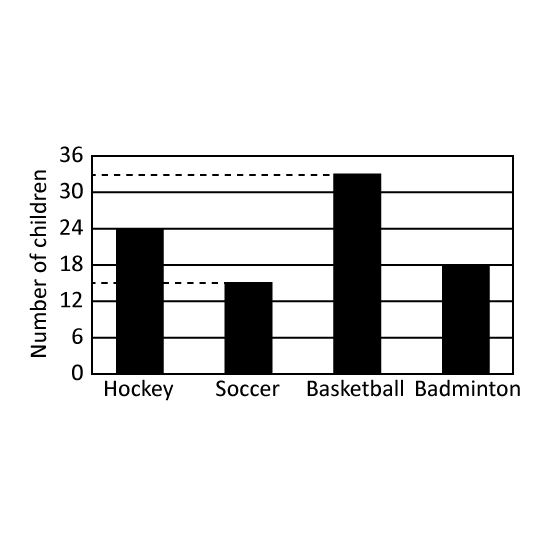
Level 2 PSLE
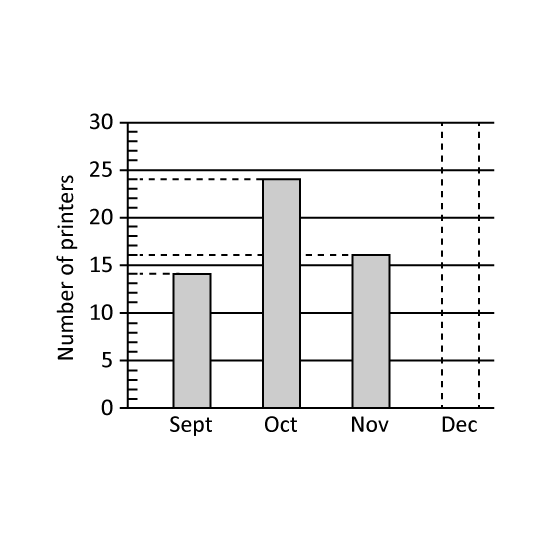
The bar graph shows the number of printers sold by Mr. Owen in 4 months. The bar that shows the number of printers sold in December has not been drawn. The number of printers sold in October was 30% of the total number of printers sold in the 4 months.
What was the total number of printers sold in the 4 months?
What was the number of printers sold in December?
Level 2 PSLE
The bar graph shows the number of printers sold by Mr. Owen in 4 months. The bar that shows the number of printers sold in December has not been drawn. The number of printers sold in October was 30% of the total number of printers sold in the 4 months.
What was the total number of printers sold in the 4 months?
Level 2 PSLE
A dancing club has 100 male and 50 female members. 10% of the male members and 40% of the female members are students. What percentage of the members are students?
Level 2
Terry bought 10 cans of Coke, 20 cans of Sprite and some Pepsi. Given that 40% of the drinks Terry bought were Pepsi, how many cans of Pepsi did he buy?
Level 2 PSLE
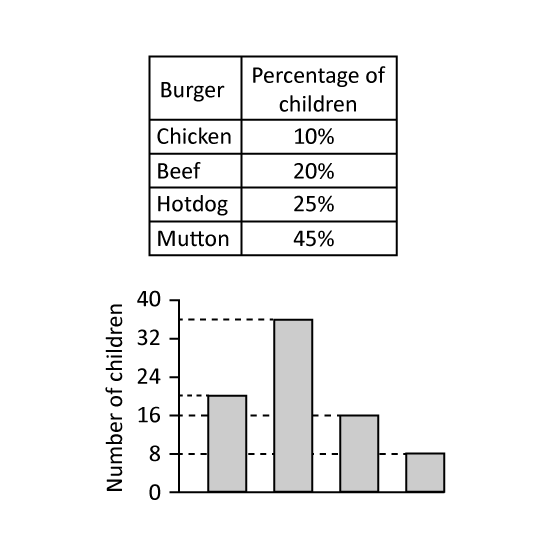
A group of children was asked to choose one burger from chicken, beef, hotdog and mutton. The table represents the children's choices. The children's choices were also represented by a bar graph but the names of the burger were not shown. What was the total number of children who chose chicken and hotdog burgers?
Level 2 PSLE
A group of children was asked to choose one burger from chicken, beef, hotdog and mutton. The table represents the children's choices. The children's choices were also represented by a bar graph but the names of the burger were not shown. What was the total number of children who chose chicken and hotdog burgers?