Level 1
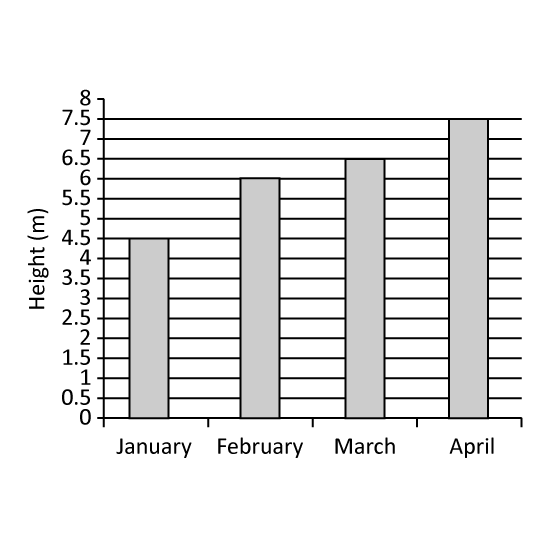
The graph shows the height of a plant on the last day of each month from January to April. In which month was the greatest increase in the plant's plant's height recorded?
Level 1
The graph shows the height of a plant on the last day of each month from January to April. In which month was the greatest increase in the plant's plant's height recorded?
Image in this question is not available.
Level 1
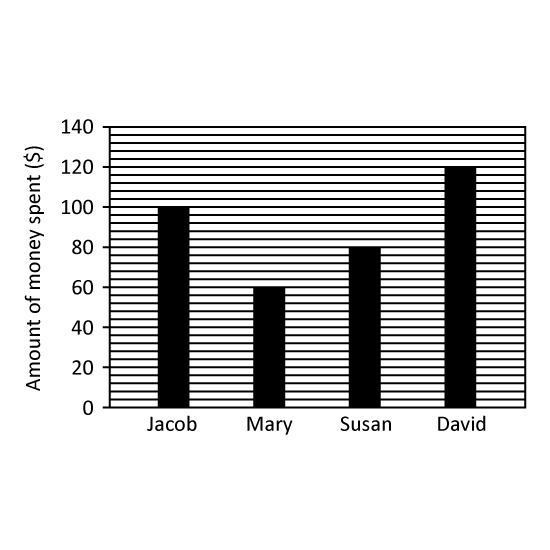
The bar graph shows the amount of money spent by 4 children.
Name the child/children who spent more than $80? Give your answer(s) in number(s). (Eg 1 or 1,2)
Level 1
The bar graph shows the amount of money spent by 4 children.
Name the child/children who spent more than $80? Give your answer(s) in number(s). (Eg 1 or 1,2)
Image in this question is not available.
Level 2
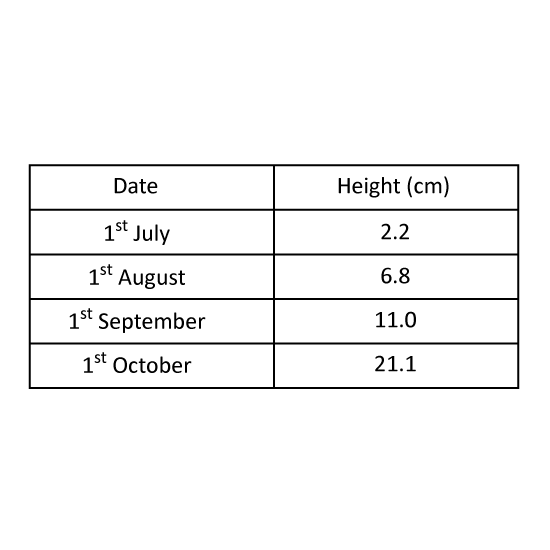
The table shows the height of a plant in centimetres on the first day of each month from July to October. In which month did the plant's height increase the most? Give your answer in this format. (Eg Jan)
Level 2
The table shows the height of a plant in centimetres on the first day of each month from July to October. In which month did the plant's height increase the most? Give your answer in this format. (Eg Jan)
Image in this question is not available.
Level 2
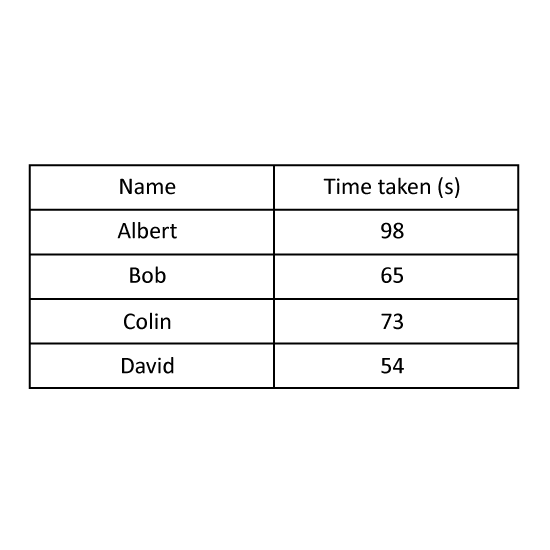
Four boys took part in a race. The table shows the time taken by the four boys.
How much faster was the fastest runner in the race compared to Bob? Give your answer in seconds.
Level 2
Four boys took part in a race. The table shows the time taken by the four boys.
How much faster was the fastest runner in the race compared to Bob? Give your answer in seconds.
Image in this question is not available.
Level 2
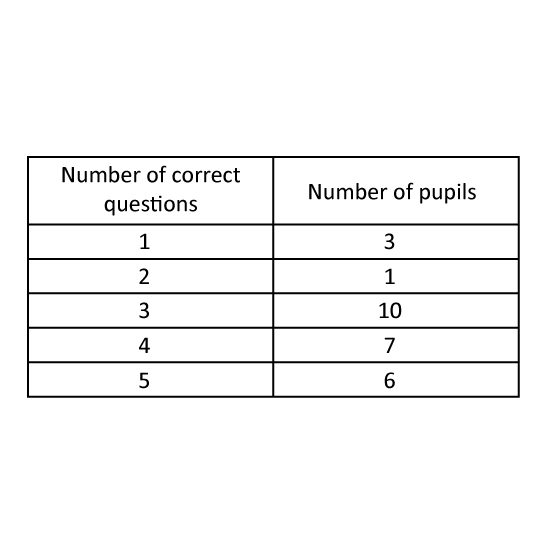
The table shows the number of questions answered correctly by the pupils in a Science pop quiz. How many pupils answered 3 or more questions correctly?
Level 2
The table shows the number of questions answered correctly by the pupils in a Science pop quiz. How many pupils answered 3 or more questions correctly?
Image in this question is not available.
Level 2
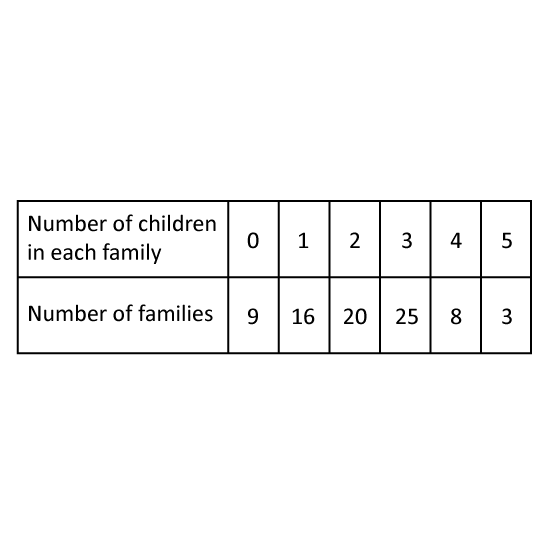
The table shows the number of children in each family in a neighbourhood. How many families have more than 3 children?
Level 2
The table shows the number of children in each family in a neighbourhood. How many families have more than 3 children?
Image in this question is not available.
Level 2
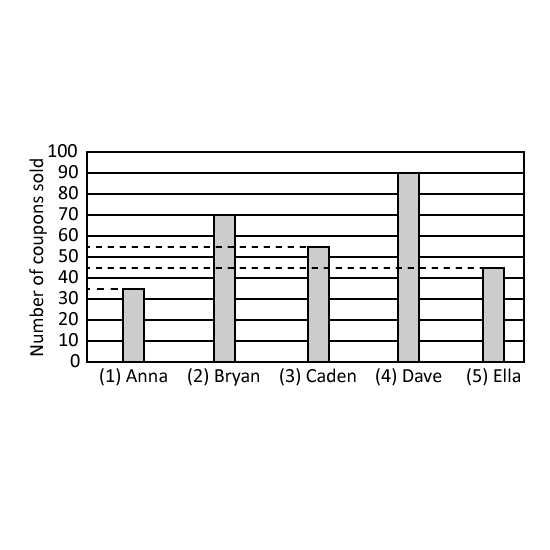
The bar graph shows the number of coupons sold by five children to raise funds for charity.
Which two boys sold the same number of coupons as David?
Level 2
The bar graph shows the number of coupons sold by five children to raise funds for charity.
Which two boys sold the same number of coupons as David?
Image in this question is not available.
Level 2
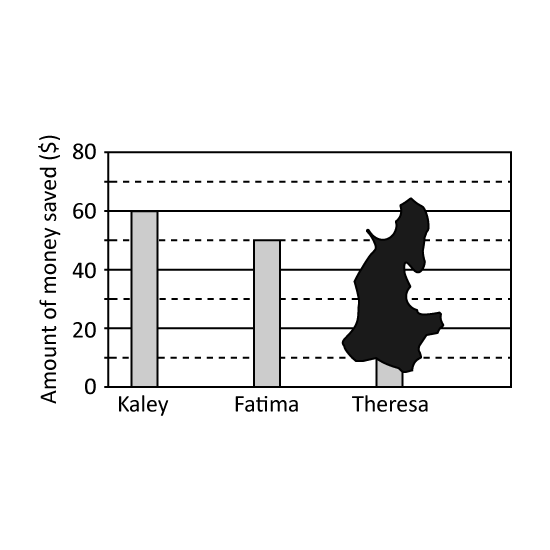
The bar graph shows the amount of money saved by 3 children in Jun.
Part of the graph had been blotted with ink. The total amount saved by the 3 children in June was $145.
- Who saved more money, Fatima or Theresa? Give your answer in number. (Eg 1)
- How much more did this child save?
Level 2
The bar graph shows the amount of money saved by 3 children in Jun.
Part of the graph had been blotted with ink. The total amount saved by the 3 children in June was $145.
- Who saved more money, Fatima or Theresa? Give your answer in number. (Eg 1)
- How much more did this child save?
Image in this question is not available.
Level 2
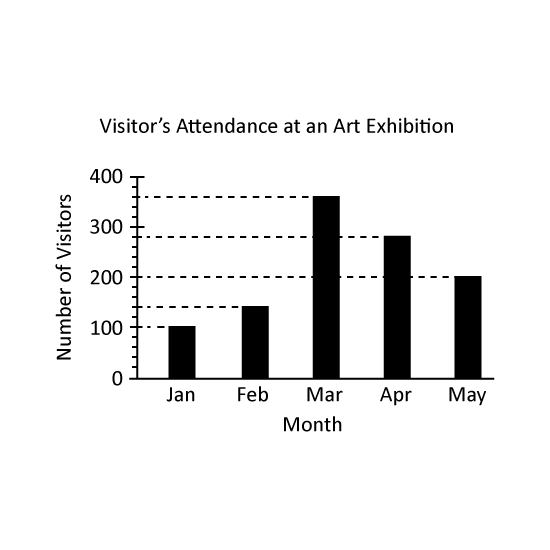
The graph shows the number of visitors who attended an art exhibition over five months. Which month has twice the number of visitors in January? Give your answer in this format. (Eg Jan)
Level 2
The graph shows the number of visitors who attended an art exhibition over five months. Which month has twice the number of visitors in January? Give your answer in this format. (Eg Jan)
Image in this question is not available.
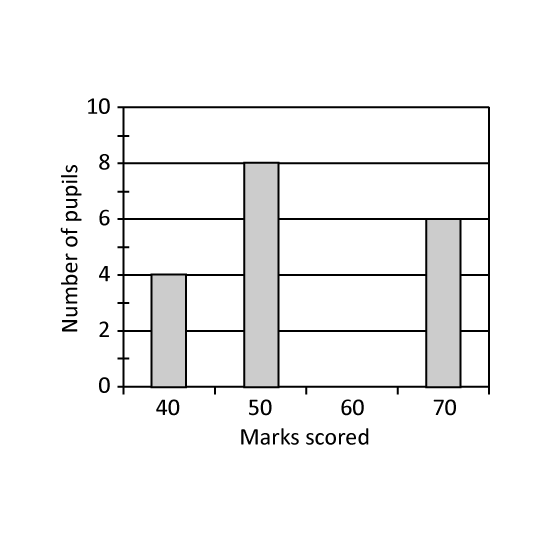
Level 2
The bar graph shows the exam results of a group of pupils. How many pupils who scored 60 marks, given that 12 of the pupils scored 50 marks and below.
Level 2
The bar graph shows the exam results of a group of pupils. How many pupils who scored 60 marks, given that 12 of the pupils scored 50 marks and below.
Image in this question is not available.
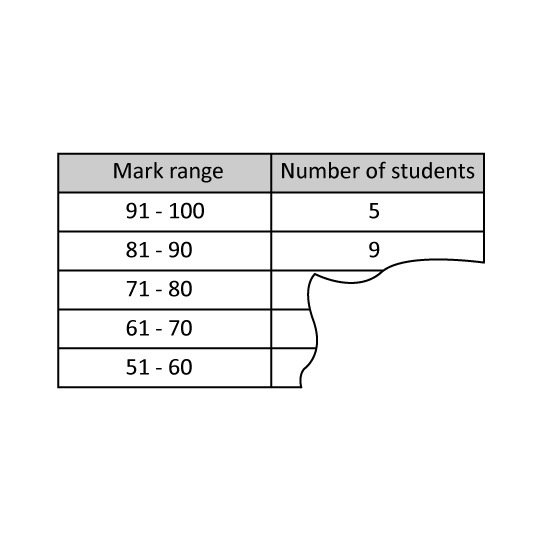
Level 2
Part of the table was accidentally torn off. The table shows the number of students from class 4C scoring within various mark ranges in a Mathematics test. 35 students scored above 70 marks. How many students scored in the mark range 71 - 80?
Level 2
Part of the table was accidentally torn off. The table shows the number of students from class 4C scoring within various mark ranges in a Mathematics test. 35 students scored above 70 marks. How many students scored in the mark range 71 - 80?
Image in this question is not available.
Level 1
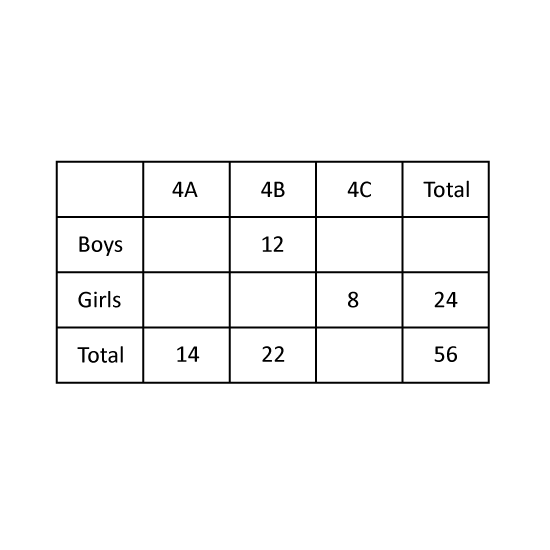
The table shows some information about the number of pupils who wear spectacles in classes 4A to 4C. How many girls in 4A wear spectacles?
Level 1
The table shows some information about the number of pupils who wear spectacles in classes 4A to 4C. How many girls in 4A wear spectacles?
Image in this question is not available.
Level 2
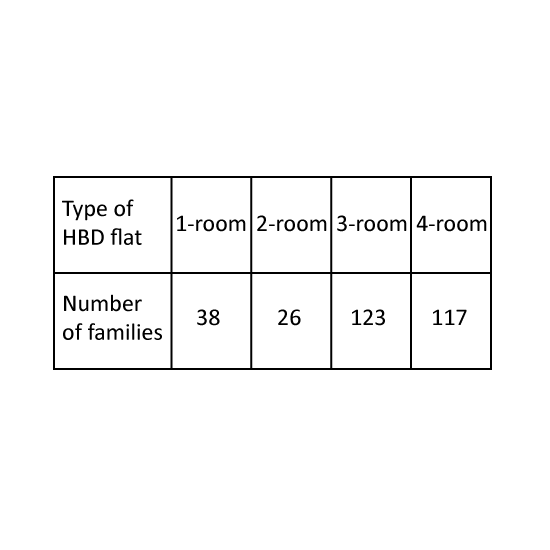
The table shows the number of families living in different types of HDB flats in a new town last year. This year, 12 families from the 1-room flats and 15 families from 2-room flat moved to 4-room flat. At the same time, 11 families from 3-room flat moved to 2-room flat. How many families live in a HDB flat with less than 3 rooms this year?
Level 2
The table shows the number of families living in different types of HDB flats in a new town last year. This year, 12 families from the 1-room flats and 15 families from 2-room flat moved to 4-room flat. At the same time, 11 families from 3-room flat moved to 2-room flat. How many families live in a HDB flat with less than 3 rooms this year?
Image in this question is not available.
Level 1
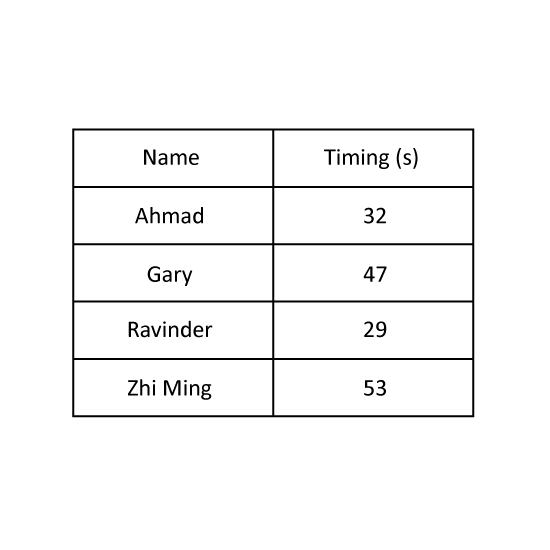
Ahmad, Gary, Ravinder and Zhi Ming had a race and their timings are recorded. Who came in second in the race?
Level 1
Ahmad, Gary, Ravinder and Zhi Ming had a race and their timings are recorded. Who came in second in the race?
Image in this question is not available.
Level 1
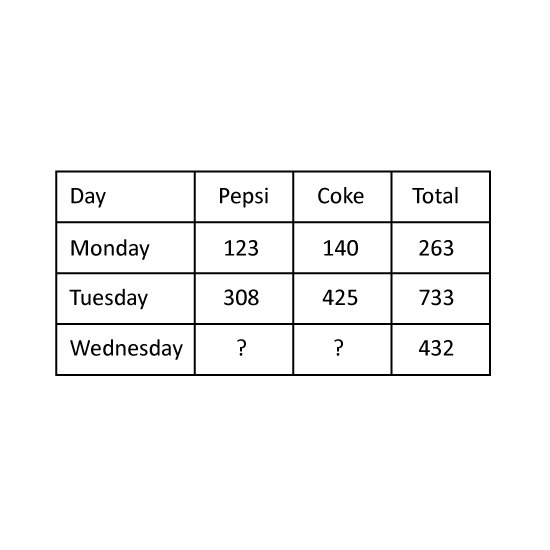
The table shows the number of canned drinks sold during a softball carnival over three days. The number of Coke sold on Wednesday is three times the number of Pepsi, how many cans of Coke were sold on Wednesday?
Level 1
The table shows the number of canned drinks sold during a softball carnival over three days. The number of Coke sold on Wednesday is three times the number of Pepsi, how many cans of Coke were sold on Wednesday?
Image in this question is not available.
Level 2
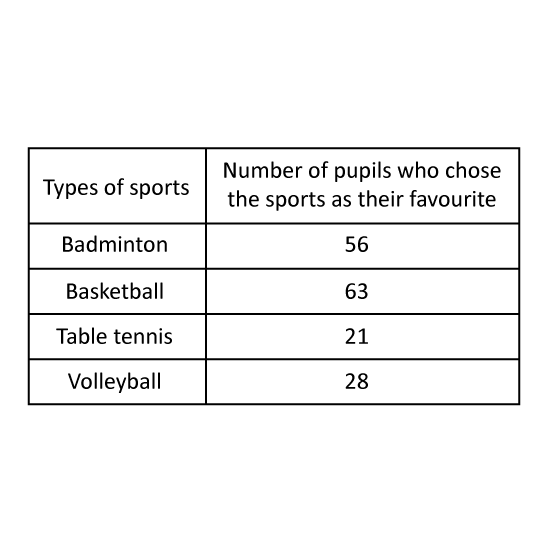
A group of 168 primary four pupils was surveyed to name their favourite sport.
The table shows their choices.
38 of the pupils chose one of the sports as their favourite. Which is the sport? Give your answer in number. (Eg 1)
Level 2
A group of 168 primary four pupils was surveyed to name their favourite sport.
The table shows their choices.
38 of the pupils chose one of the sports as their favourite. Which is the sport? Give your answer in number. (Eg 1)
Image in this question is not available.
Level 2
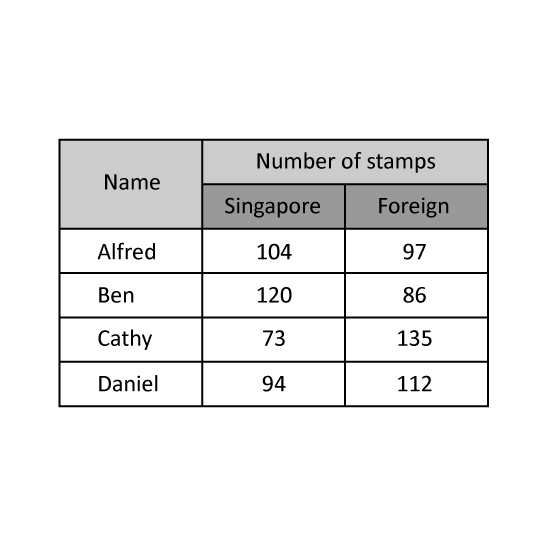
The table shows the types of stamps collected by 4 children.
- Who collected the most number of stamps?
- Cathy wanted to give 13 of her foreign stamps to the other 3 children. If each child received the same number of stamps from Cathy, how many stamps did each of them receive?
Level 2
The table shows the types of stamps collected by 4 children.
- Who collected the most number of stamps?
- Cathy wanted to give 13 of her foreign stamps to the other 3 children. If each child received the same number of stamps from Cathy, how many stamps did each of them receive?
Image in this question is not available.
Level 2
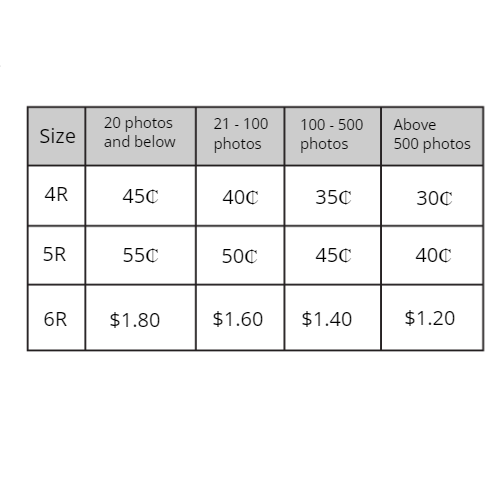
The table shows the charges for printing photos at a photo centre. Neave printed 64 4R photos and 165 5R photos. How much did he pay in total?
Level 2
The table shows the charges for printing photos at a photo centre. Neave printed 64 4R photos and 165 5R photos. How much did he pay in total?
Image in this question is not available.
Level 2
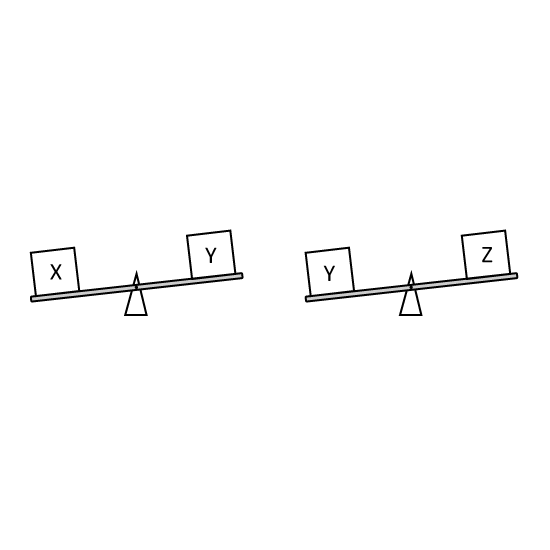
Robert was comparing the mass of 3 boxes as shown . If you will make a line graph for this, which box is at the highest point? Express your answer as the letter of the correct box.
Level 2
Robert was comparing the mass of 3 boxes as shown . If you will make a line graph for this, which box is at the highest point? Express your answer as the letter of the correct box.
Image in this question is not available.
Level 2
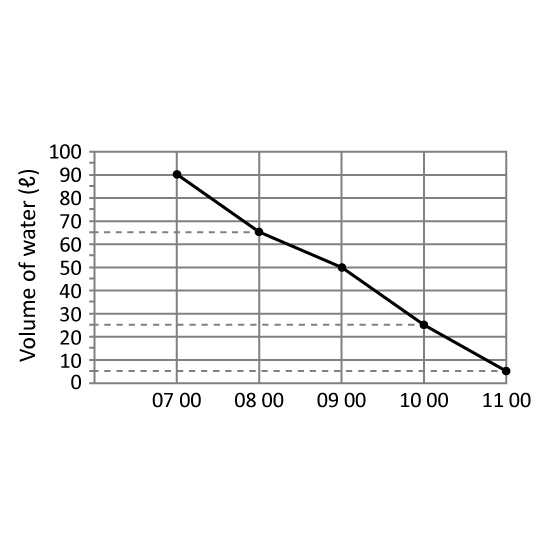
A tank was filled with 90 ℓ of water at 07 00. Water flowed out of the tank from 07 00 to 11 00. The line graph shows the amount of water in the tank from 07 00 to 11 00. Which one-hour period shows the least decrease in the amount of water in the tank? Give your answer in this format. (Eg 12 00 to 13 00)
Level 2
A tank was filled with 90 ℓ of water at 07 00. Water flowed out of the tank from 07 00 to 11 00. The line graph shows the amount of water in the tank from 07 00 to 11 00. Which one-hour period shows the least decrease in the amount of water in the tank? Give your answer in this format. (Eg 12 00 to 13 00)
Image in this question is not available.