Level 1
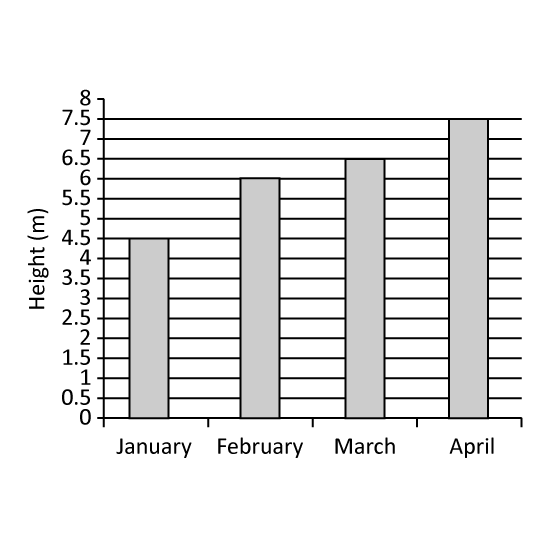
The graph shows the height of a plant on the last day of each month from January to April. In which month was the greatest increase in the plant's plant's height recorded?
Level 1
The graph shows the height of a plant on the last day of each month from January to April. In which month was the greatest increase in the plant's plant's height recorded?
Image in this question is not available.
Level 1
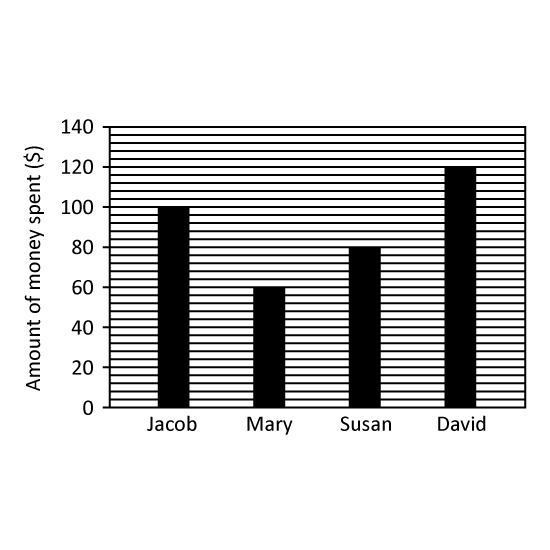
The bar graph shows the amount of money spent by 4 children.
Name the child/children who spent more than $80? Give your answer(s) in number(s). (Eg 1 or 1,2)
Level 1
The bar graph shows the amount of money spent by 4 children.
Name the child/children who spent more than $80? Give your answer(s) in number(s). (Eg 1 or 1,2)
Image in this question is not available.
Level 2
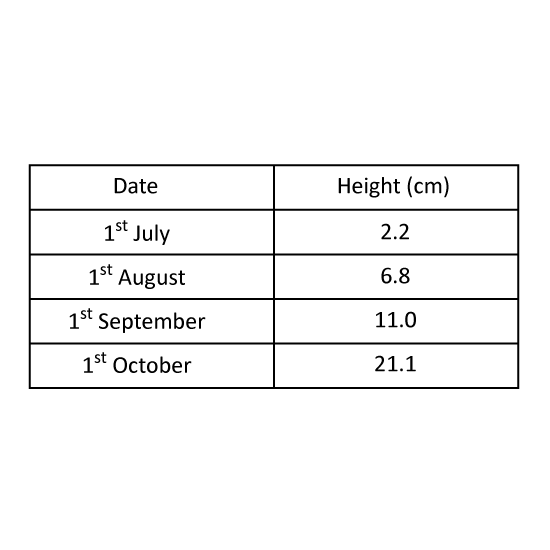
The table shows the height of a plant in centimetres on the first day of each month from July to October. In which month did the plant's height increase the most? Give your answer in this format. (Eg Jan)
Level 2
The table shows the height of a plant in centimetres on the first day of each month from July to October. In which month did the plant's height increase the most? Give your answer in this format. (Eg Jan)
Image in this question is not available.
Level 2
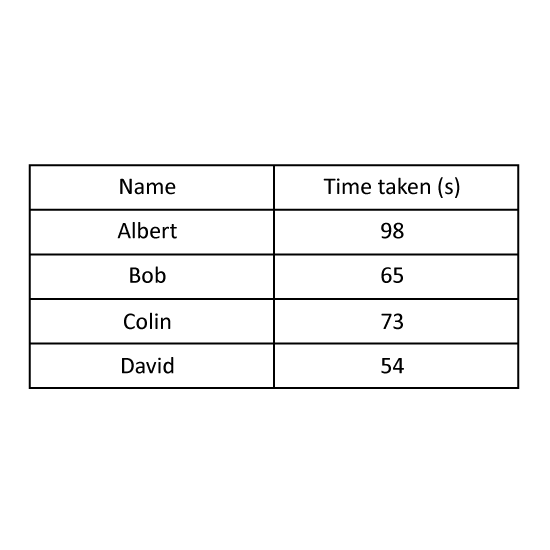
Four boys took part in a race. The table shows the time taken by the four boys.
How much faster was the fastest runner in the race compared to Bob? Give your answer in seconds.
Level 2
Four boys took part in a race. The table shows the time taken by the four boys.
How much faster was the fastest runner in the race compared to Bob? Give your answer in seconds.
Image in this question is not available.
Level 2
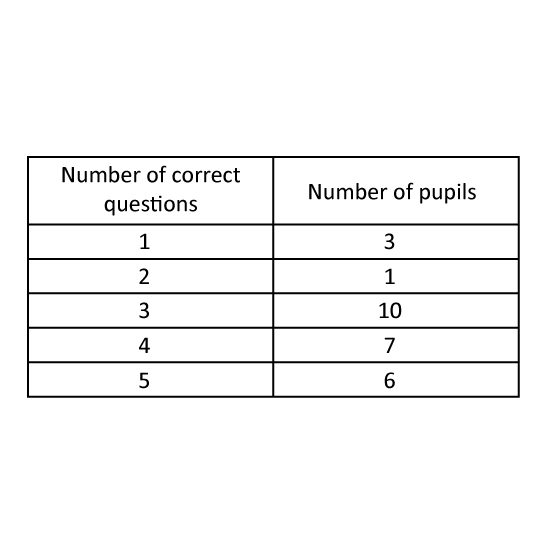
The table shows the number of questions answered correctly by the pupils in a Science pop quiz. How many pupils answered 3 or more questions correctly?
Level 2
The table shows the number of questions answered correctly by the pupils in a Science pop quiz. How many pupils answered 3 or more questions correctly?
Image in this question is not available.
Level 2
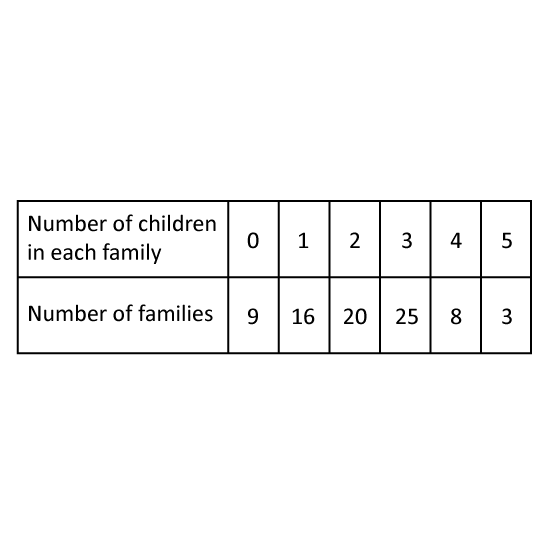
The table shows the number of children in each family in a neighbourhood. How many families have more than 3 children?
Level 2
The table shows the number of children in each family in a neighbourhood. How many families have more than 3 children?
Image in this question is not available.
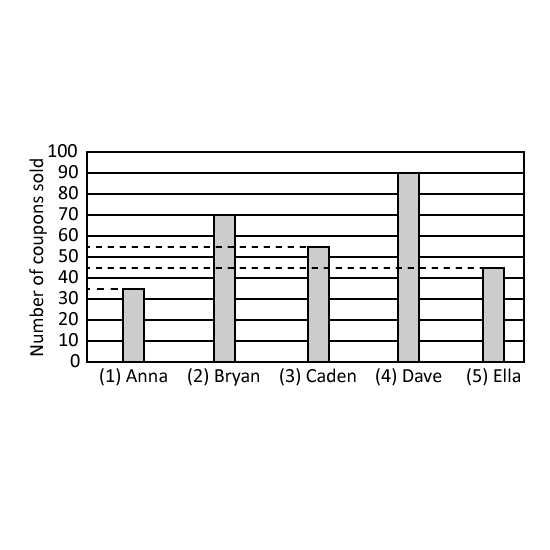
Level 2
The bar graph shows the number of coupons sold by five children to raise funds for charity.
Which two boys sold the same number of coupons as David?
Level 2
The bar graph shows the number of coupons sold by five children to raise funds for charity.
Which two boys sold the same number of coupons as David?
Image in this question is not available.
Level 2
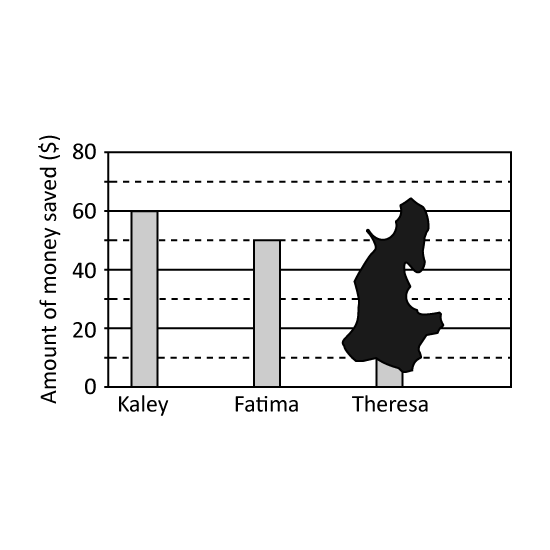
The bar graph shows the amount of money saved by 3 children in Jun.
Part of the graph had been blotted with ink. The total amount saved by the 3 children in June was $145.
- Who saved more money, Fatima or Theresa? Give your answer in number. (Eg 1)
- How much more did this child save?
Level 2
The bar graph shows the amount of money saved by 3 children in Jun.
Part of the graph had been blotted with ink. The total amount saved by the 3 children in June was $145.
- Who saved more money, Fatima or Theresa? Give your answer in number. (Eg 1)
- How much more did this child save?
Image in this question is not available.
Level 2
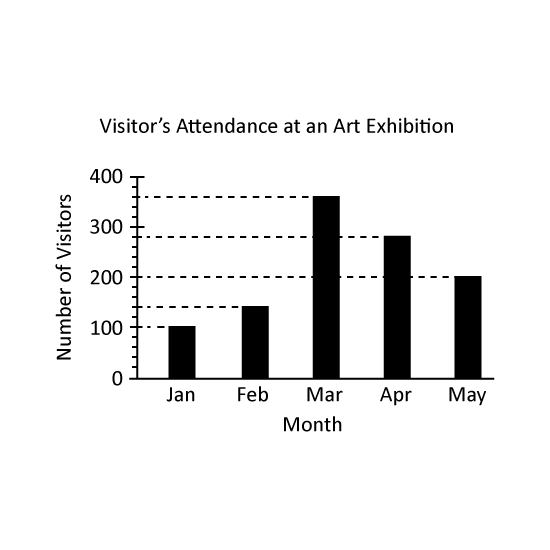
The graph shows the number of visitors who attended an art exhibition over five months. Which month has twice the number of visitors in January? Give your answer in this format. (Eg Jan)
Level 2
The graph shows the number of visitors who attended an art exhibition over five months. Which month has twice the number of visitors in January? Give your answer in this format. (Eg Jan)
Image in this question is not available.
Level 2
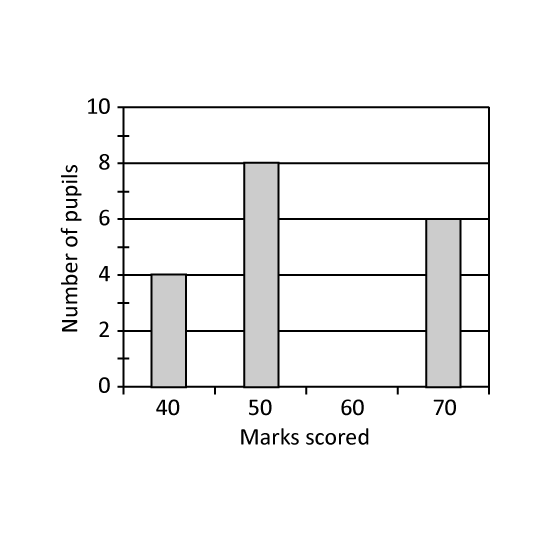
The bar graph shows the exam results of a group of pupils. How many pupils who scored 60 marks, given that 12 of the pupils scored 50 marks and below.
Level 2
The bar graph shows the exam results of a group of pupils. How many pupils who scored 60 marks, given that 12 of the pupils scored 50 marks and below.
Image in this question is not available.