Level 1
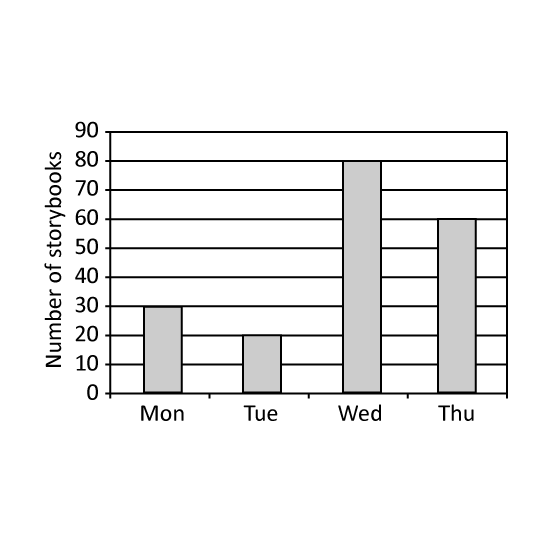
The graph shows the number of story books borrowed from a library over 4 days. What is the total number of story books borrowed from Monday to Thursday?
Level 1
The graph shows the number of story books borrowed from a library over 4 days. What is the total number of story books borrowed from Monday to Thursday?
Level 1
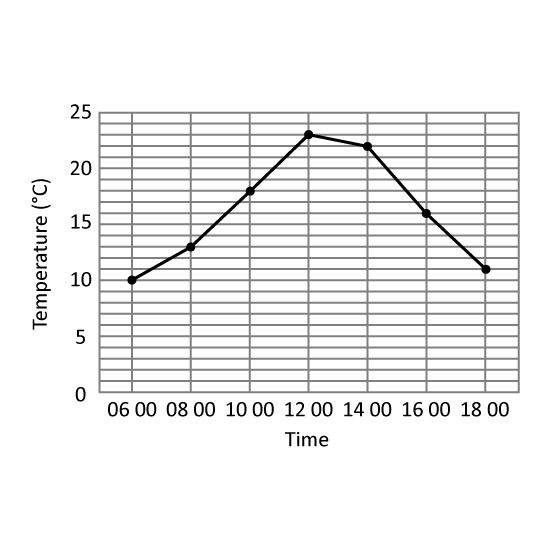
The table shows the temperature change in Hillview Town.
At which 2 hour-interval of the day was there the greatest change in temperature? Give your answer in this format. (Eg 1200 to 1400)
Level 1
The table shows the temperature change in Hillview Town.
At which 2 hour-interval of the day was there the greatest change in temperature? Give your answer in this format. (Eg 1200 to 1400)