Level 2
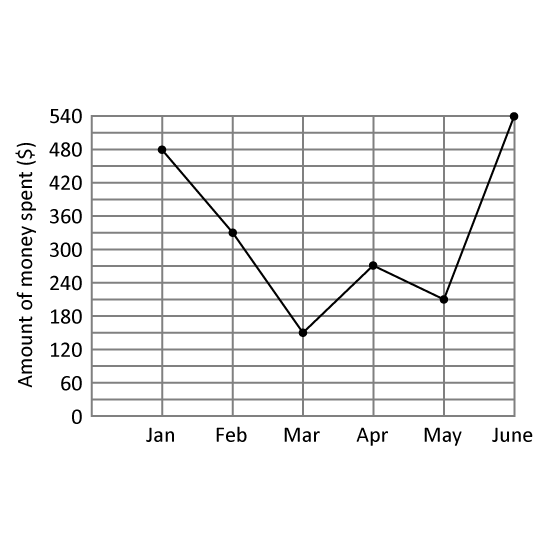
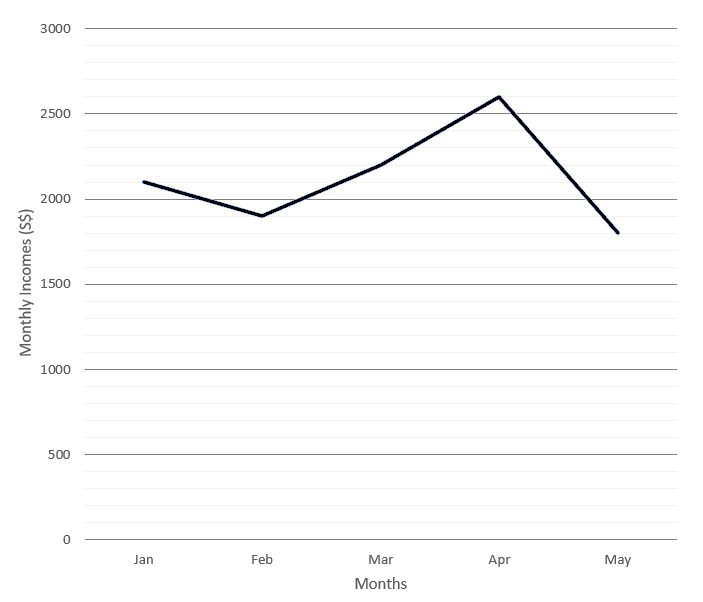
The line graph shows the amount of money Joseph spent from January to June.
Of the amount Joseph spent in February, $138 was spent on clothes and the remaining amount was spent on food. How much did he spend on food in February?
In which month did Joseph spend $120 more than the previous month? Give your answer in this format. (Eg Jan)
Level 2
The line graph shows the amount of money Joseph spent from January to June.
Of the amount Joseph spent in February, $138 was spent on clothes and the remaining amount was spent on food. How much did he spend on food in February?
In which month did Joseph spend $120 more than the previous month? Give your answer in this format. (Eg Jan)
Level 3
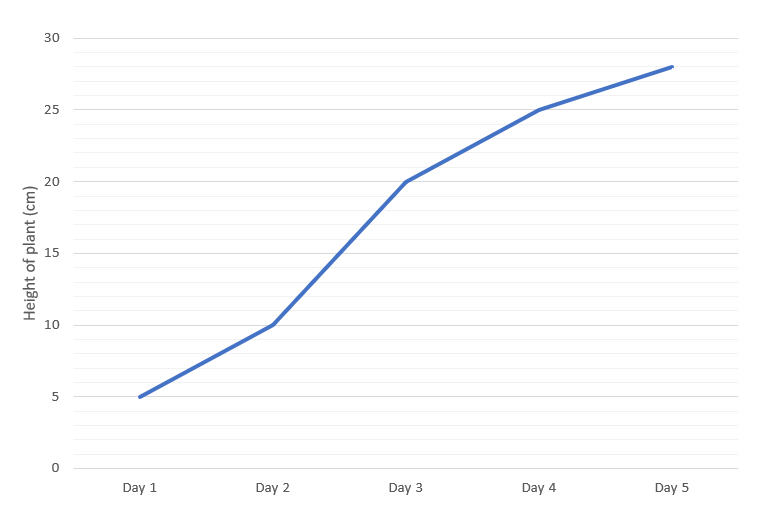
Marissa bought a plant that was 5 cm tall. Every morning, she measured the height of the plant and recorded its height for the day. The line graph shows her records.
What was the height of the plant when it was measured on Day 3?
Between which two days was the increase in the height of the plant the greatest? Give the answer in numbers. (Eg 1, 2)
In Day 6, the height of the plant dropped to 35 of Day 4. What is the height of the plant on Day 6?
Level 3
Marissa bought a plant that was 5 cm tall. Every morning, she measured the height of the plant and recorded its height for the day. The line graph shows her records.
What was the height of the plant when it was measured on Day 3?
Between which two days was the increase in the height of the plant the greatest? Give the answer in numbers. (Eg 1, 2)
In Day 6, the height of the plant dropped to 35 of Day 4. What is the height of the plant on Day 6?