Level 1
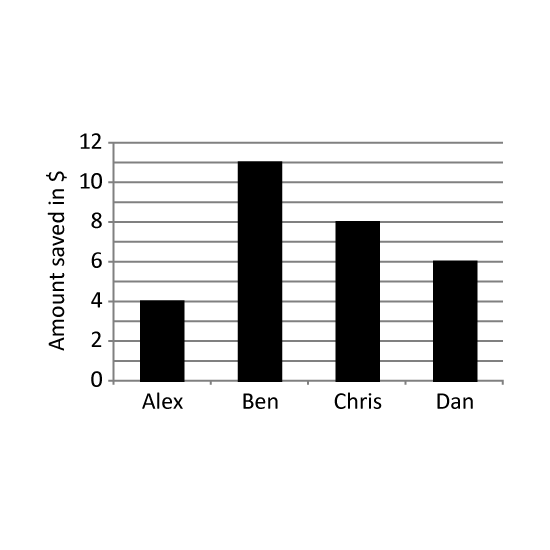
Four friends were given a sum of $25 each. The bar graph shows the amount of money saved by each of them in the week. How much did they spend together?
Level 1
Four friends were given a sum of $25 each. The bar graph shows the amount of money saved by each of them in the week. How much did they spend together?
Level 2
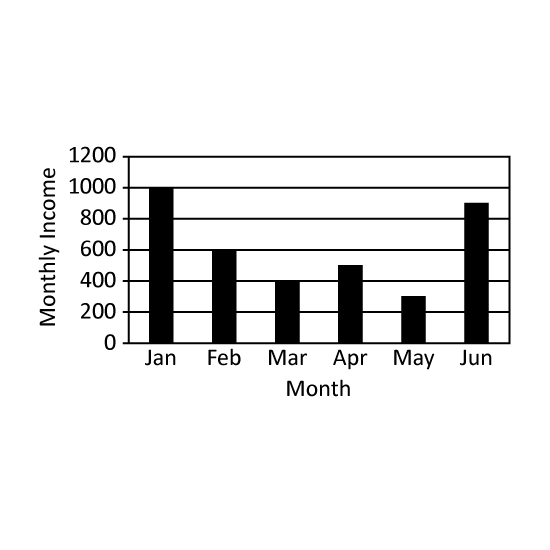
The graph shows the monthly income of Mr Chai for the first half of the year. In which month was his income 35 of her combined income in January and April? Give the answer in short form. (Eg Jan)
Level 2
The graph shows the monthly income of Mr Chai for the first half of the year. In which month was his income 35 of her combined income in January and April? Give the answer in short form. (Eg Jan)
Level 2
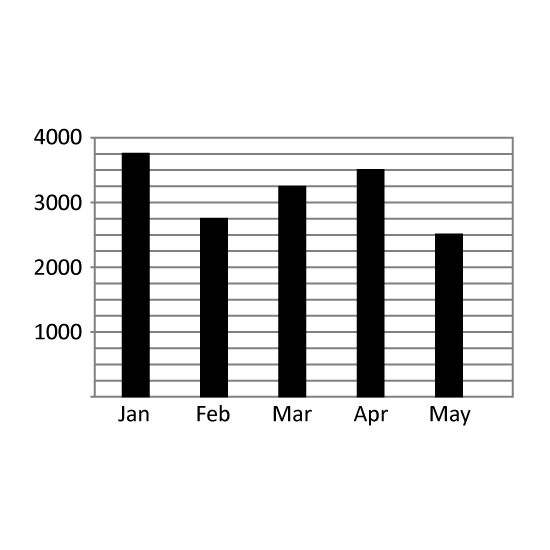
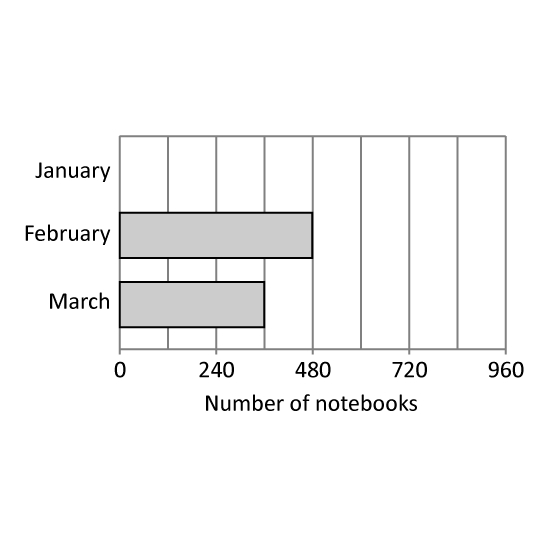
The bar graph shows the number of notebooks sold in 3 months. The bar that shows the number of notebooks in January is not drawn. 38 of the total number of notebooks sold in the 3 months were sold in January. How many notebooks were sold in January?
Level 2
The bar graph shows the number of notebooks sold in 3 months. The bar that shows the number of notebooks in January is not drawn. 38 of the total number of notebooks sold in the 3 months were sold in January. How many notebooks were sold in January?