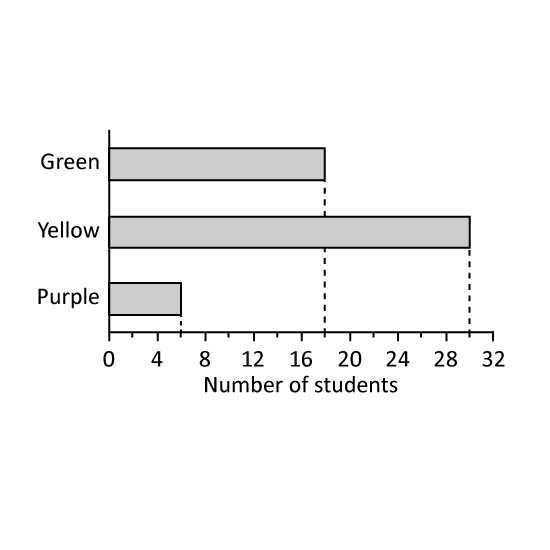
Level 1 PSLE
Mr Lim asked some students to choose their favorite colour for a T-shirt. The results are shown in the graph.
What is the ratio of the number of students who chose purple to the number who chose green to the number who chose yellow?
Mr Yip ordered a total of 360 T-shirts in the three colours according to the same ratio in part (a). How many more yellow than purple T-shirts were ordered?
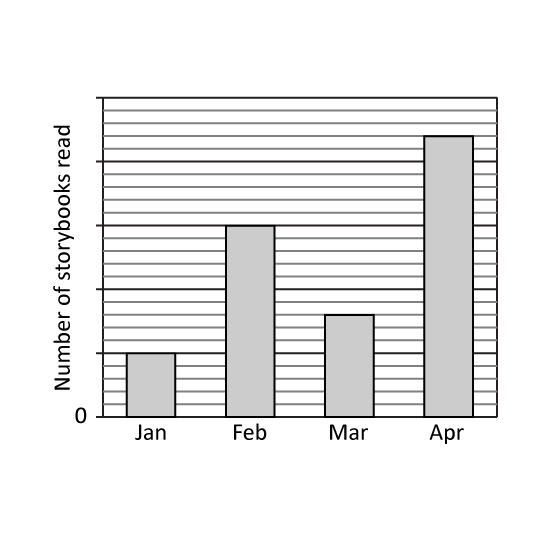
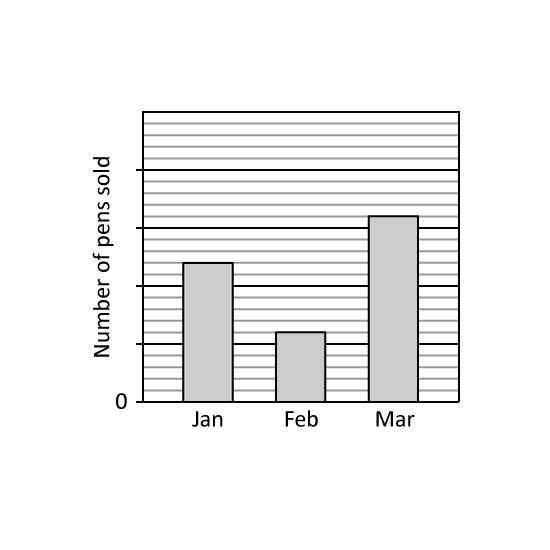
Level 2 PSLE
The bar graph shows the number of storybooks read by a class from January to April. The number of storybooks read is not shown on the scale.
What was the percentage increase in the number of storybooks read from January to February?
The average number of books read in a month from January to April was 25. How many books did the class read in April?
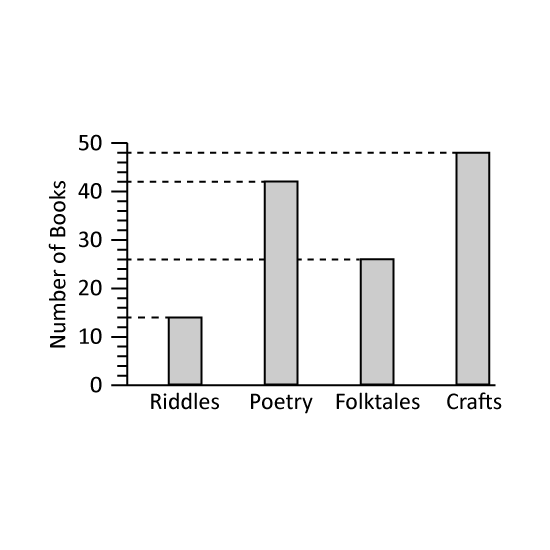
Level 3 PSLE
Books in a class library are grouped according to the following four types: Riddles, Poetry, Folktale, and Crafts. The bar graph shows the number of books of each type in the class library.
What percentage of books in the class library was of the Folktale type?
There were 38 students in the class. Every student in the class took three or four books home to read over the weekend. No book was left in the classroom. How many students took three books home?
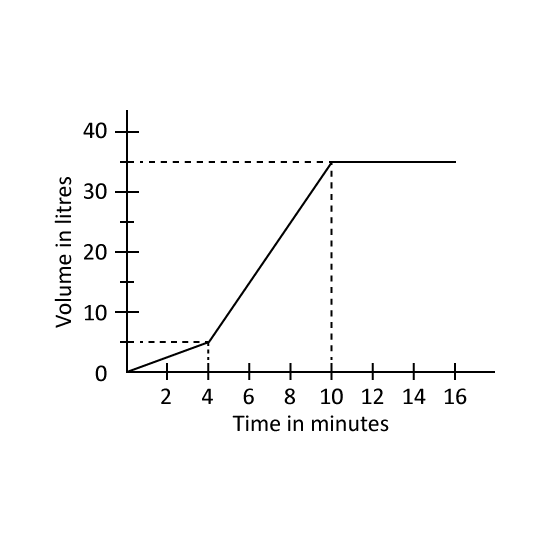
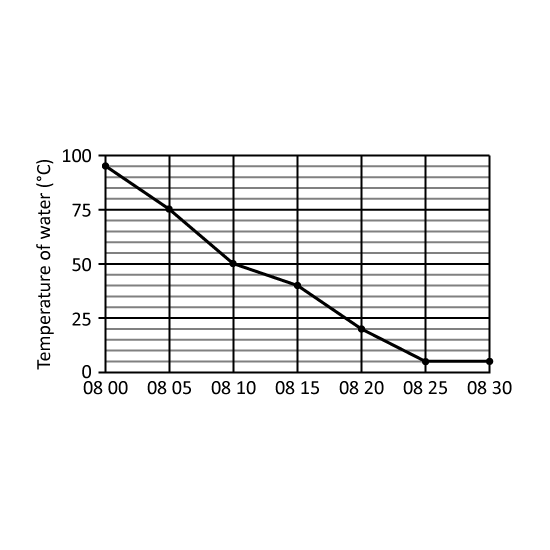
Level 2 PSLE
Carlo filled a container with water using two taps. He turned on Tap A first and after 4 minutes, he also turned on Tap B. Both taps were turned off at the same time when the container was completely filled without overflowing. The graph shows the amount of water in the container over 16 minutes.
What fraction of the container was filled 4 minutes after Tap A was turned on? Express your answer in the simplest form.
In one minute, how many litres of water flowed from Tap B?
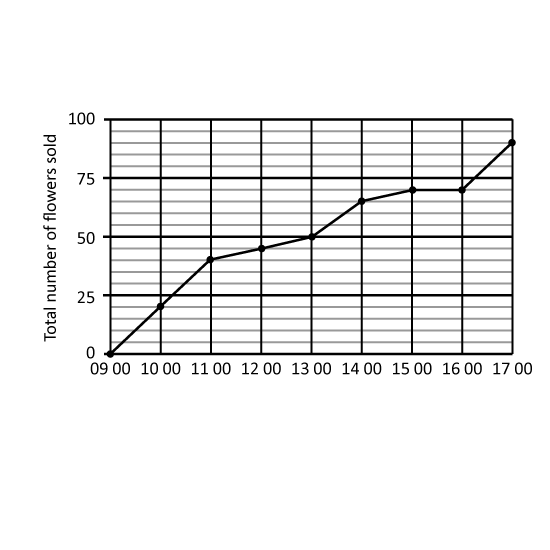
Level 2 The graph shows the amount of money Ron saved from his pocket money every month from January to May.
How much money did Ron save altogether from January to May?
What was the average amount of money Ron saved from January to May?
Ron saved $80 in June. The amount saved increased by 100% from June to July and another 100% from July to August. How much money did Ron save in August?
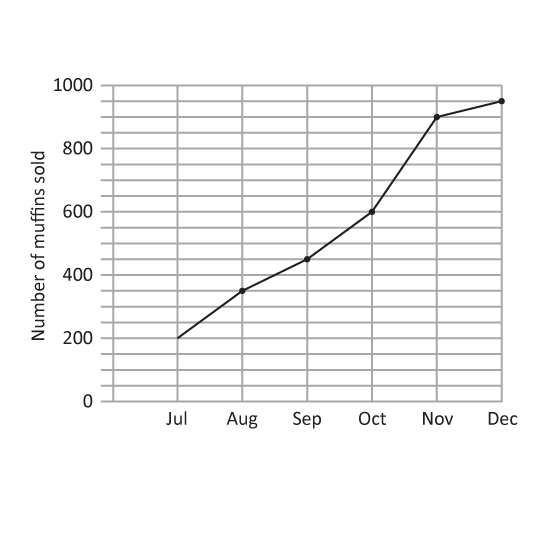
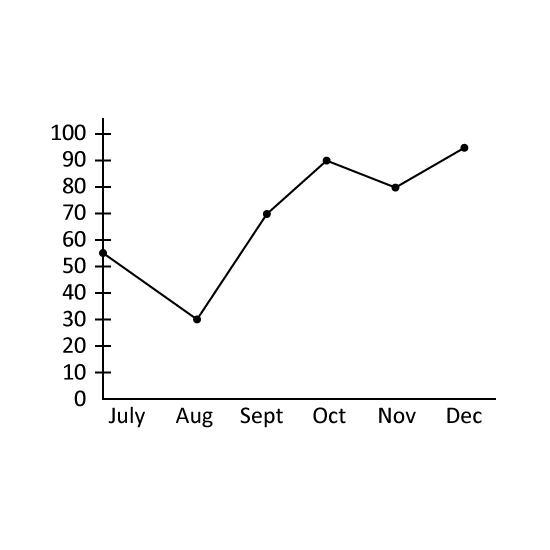
Level 3
The line graph shows the number of dresses sold by a shop from July to December in 2013.
What was the average number of dresses sold per month from July to December in 2013?
The total number of dresses sold for the same period from July to December in 2012 was 672. Find the percentage decrease in the total number of dresses sold for the same period from 2012 to 2013.
Level 3
Four children made the following statements.
Winnie : The average of Yoko's mass and my mass is 39 kg.
Xtra : I am the heaviest.
Yoko : Zane is 2 kg lighter than Xtra.
Zane : Our masses are in consecutive order (In running sequence).
What is the total mass of Winnie, Xtra and Yoko ?
Level 3
Farmer Nick has 4 rabbits. The mass of Rabbit G is the same as the average mass of the 4 rabbits. Rabbit H weighs 5 kg less than the average mass of the 4 rabbits. The mass of Rabbit I is 7 kg more than the average mass of the 4 rabbits. The mass of Rabbit J is 34 kg. Find the total mass of the 4 rabbits.
Level 3
The mass of 4 children, Mandy, Nellie, Peter and Richie were taken. Only 3 children can be weighed at one time. Mandy, Nellie and Peter weighed a total of 55 kg. Nellie, Peter and Richie weighed a total of 56 kg. Mandy, Peter and Richie weighed a total of 57 kg. Mandy, Nellie, and Richie weighed a total of 60 kg. What is the average mass of the 4 children?
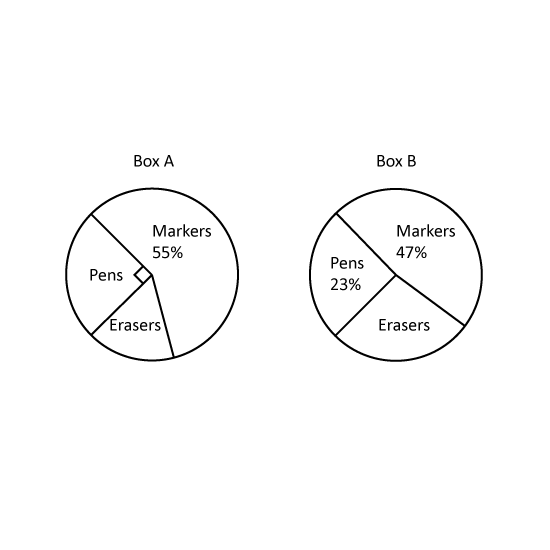
Level 2 The pie charts show the number of each type of stationery in boxes, A and B. The total number of stationery in Box A is twice the total number of stationery in Box B.
Find the percentage of erasers in Box A.
What fraction of stationery in Box B is erasers?
The number of erasers in Box A is 40. Find the number of erasers in Box B.
Level 3
Some pupils took a Math exam. Their average score was 74.7 marks. One of the pupils' scores was wrongly recorded as 68 marks instead of 86 marks. As a result, the average score was calculated as 73.5 marks. How many pupils sat for the exam?
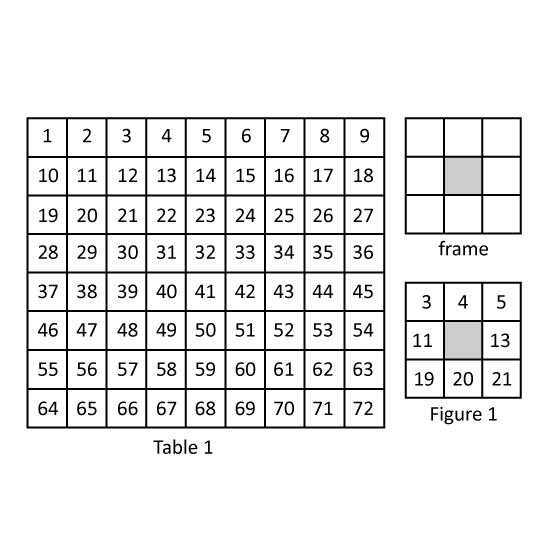
Level 3 PSLE
Table 1 consists of numbers from 1 to 72. Kenny and Lionel are given a plastic frame that covers exactly 9 squares of Table 1 with the centre square covered.
Kenny puts the frame on the 9 squares shown in Figure 1. What is the average of the 8 numbers that can be seen in the frame?
Lionel puts the frame on some other 9 squares. The sum of the 8 numbers that can be seen in the frame is 320. What is the smallest number that can be seen in the frame?
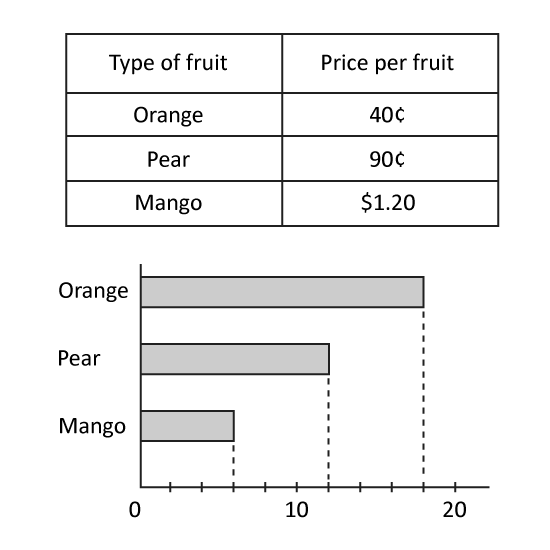
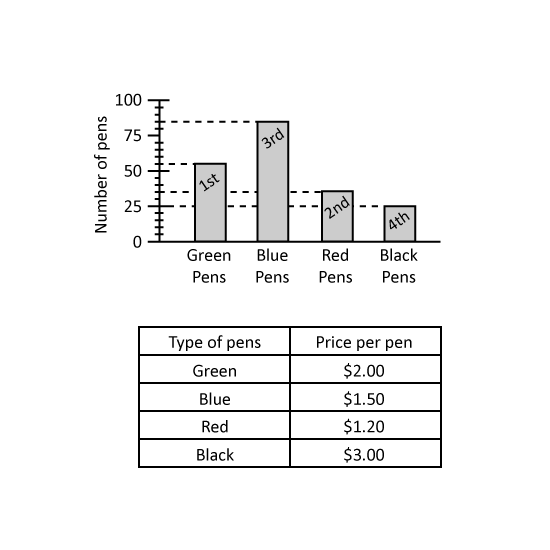
Level 2 PSLE
The bar graph shows the number of coloured pens sold by a shop. The table shows the prices of the pens.
What fraction of the pens sold were black pens? Give the answer in the simplest form.
From the sale of the pens, which coloured pens collected the least amount of money? What was the amount? Give the answers in the following way. (Eg Green, $1)
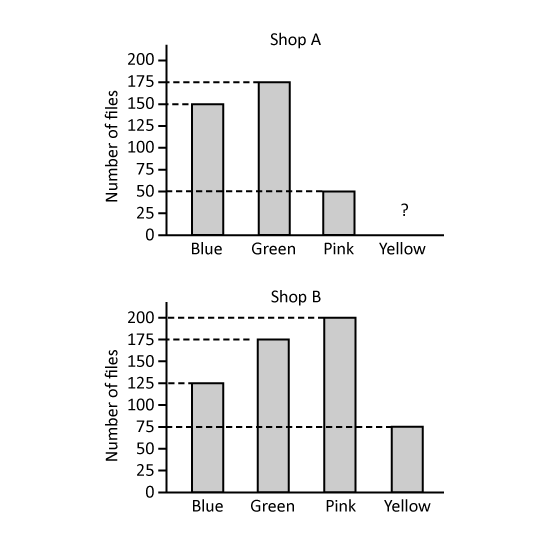
Level 2 PSLE
Shops A and B sell highlighters of four colours. The bar graphs show the number of highlighters sold by each shop in April.
The bar for the number yellow highlighters sold by Shop A has not been drawn.
Half of the highlighters sold by Shop A were yellow highlighters. How many yellow highlighters did Shop A sell?
Which colour(s) of highlighters did Shop A sell less than Shop B? (Give your answer(s) in letter(s) in alphabetical order. Eg Blue, Red = B, R
In May, Shop B sold 75 more blue highlighters than the number of blue highlighters sold in April. What was the percentage increase in the number of blue highlighters sold by Shop B from April to May?