Level 2
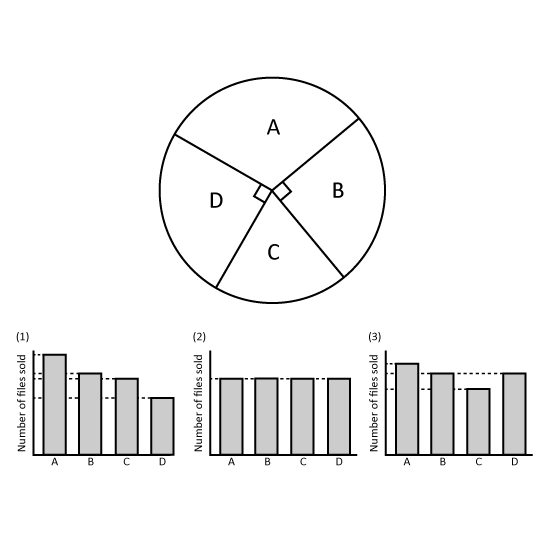
The pie chart shows the number of three types of files sold by a bookstore last week. Which bar graph best represents the information in the pie chart? Give your answer in number. (Eg 1)
Level 2
The pie chart shows the number of three types of files sold by a bookstore last week. Which bar graph best represents the information in the pie chart? Give your answer in number. (Eg 1)
Level 1 PSLE
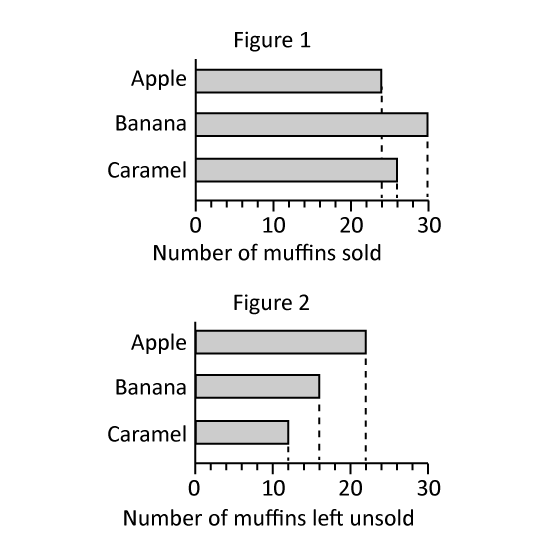
Jen baked some muffins to sell at a funfair. Figure 1 shows the number of muffins that was sold. Figure 2 shows the number of muffins left unsold at the end of the funfair.
What was the number of caramel muffins Jen baked?
Altogether, how many apples and banana muffins were left unsold after the funfair?
Level 1 PSLE
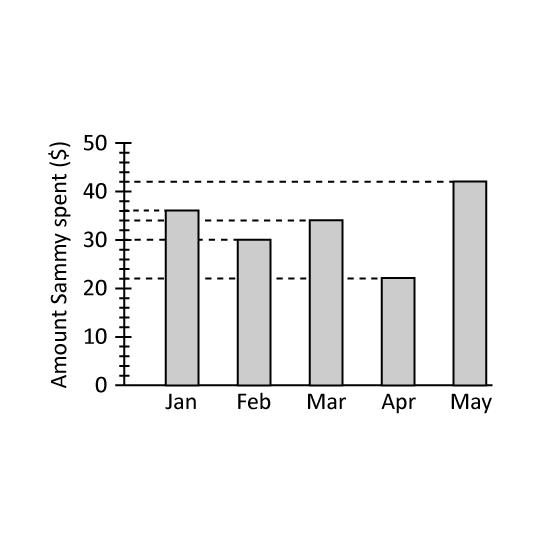
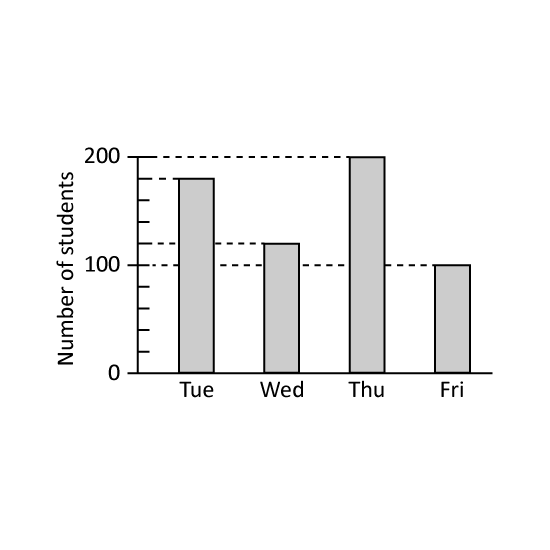
A school conducted checks on its Primary 6 students' eyesight from Tuesday to Friday. Each student had their eyes checked on one of the four days. The bar graph shows the number of students that were checked on each day. What percentage of the Primary 6 students had their eyes checked on Tuesday?
Level 1 PSLE
A school conducted checks on its Primary 6 students' eyesight from Tuesday to Friday. Each student had their eyes checked on one of the four days. The bar graph shows the number of students that were checked on each day. What percentage of the Primary 6 students had their eyes checked on Tuesday?