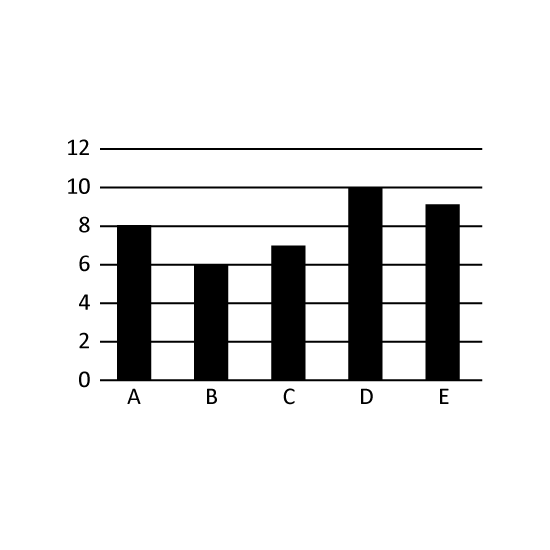
Level 2
The bar graph shows the number of students in each class. How many more students are in Class D than in Class C? Express it as a percentage of the total number of students in all the classes.
Level 2
The bar graph shows the number of students in each class. How many more students are in Class D than in Class C? Express it as a percentage of the total number of students in all the classes.