Level 3 PSLE
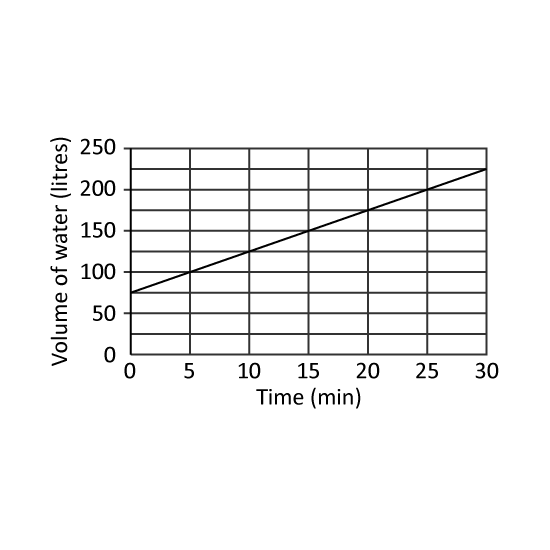
At first, 18 of a tank was filled with water. A tap was turned on for 30 min for more water to flow into the tank. It was then turned off. The line graph shows the volume of water in the tank over the 30 min.
How many litres of water flowed into the tank in one minute?
At the end of 30 min, what fraction of the tank was filled with water?
The tap was turned on again to fill up the tank at the same rate as before. How many more minutes did it take for the tank to be filled completely?
Level 3 PSLE
At first, 18 of a tank was filled with water. A tap was turned on for 30 min for more water to flow into the tank. It was then turned off. The line graph shows the volume of water in the tank over the 30 min.
How many litres of water flowed into the tank in one minute?
At the end of 30 min, what fraction of the tank was filled with water?
The tap was turned on again to fill up the tank at the same rate as before. How many more minutes did it take for the tank to be filled completely?
Level 3
The average points accumulated by 6 children is 91.5. They have all attained different points which are whole numbers. The lowest point is 70 while the highest point is 100.
Find the average points achieved by the 4 children whose marks lie between the highest and the lowest.
Find the smallest possible second lowest mark among these 6 children.
Find the largest possible second lowest mark among these 6 children.
Level 3
On 1 May to 4 May, an average of 50 waffles were sold and from 5 May to 9 May, an average of 24 waffles were sold. $240 worth of waffles were sold from 10 May to 20 May. Given that a waffle was sold for $2, find the average number of waffles sold from 1 May to 20 May.