Level 2 PSLE
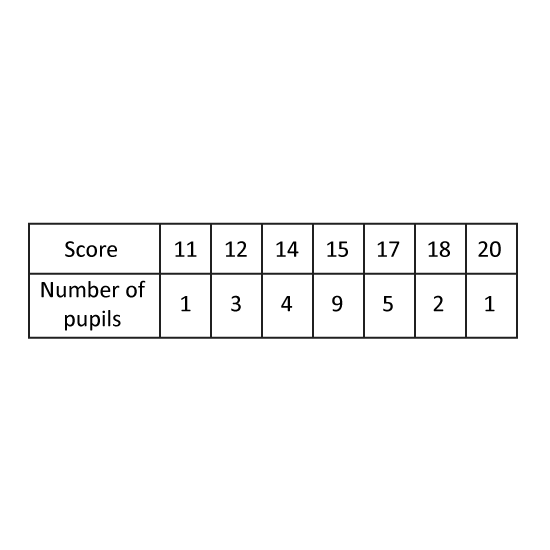
The table shows the number of pupils with the following scores. A higher score means a better performance. Prizes were given to the top 8 pupils. Aaron won a prize. What was the lowest he could have scored?
Level 2 PSLE
The table shows the number of pupils with the following scores. A higher score means a better performance. Prizes were given to the top 8 pupils. Aaron won a prize. What was the lowest he could have scored?
Level 2 PSLE
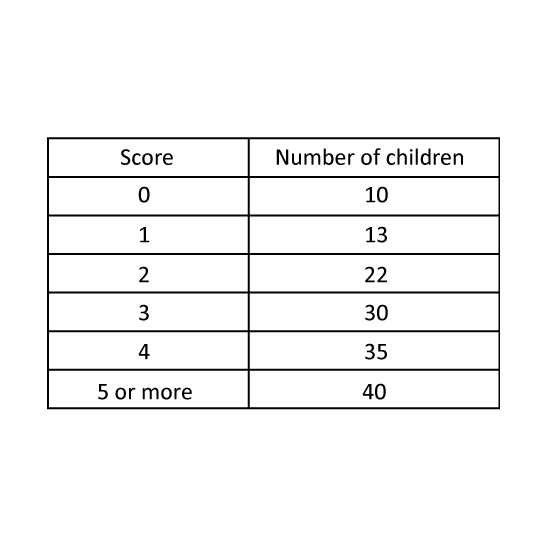
Participants of a quiz must obtain at least a certain score in the first round to qualify for the next round. There were 150 participants in the first round and the table shows the number of participants for each score. 50% of the participants did not qualify for the next round. From the table, what was the lowest score of a participant who qualified for the next round?
Level 2 PSLE
Participants of a quiz must obtain at least a certain score in the first round to qualify for the next round. There were 150 participants in the first round and the table shows the number of participants for each score. 50% of the participants did not qualify for the next round. From the table, what was the lowest score of a participant who qualified for the next round?