Level 1
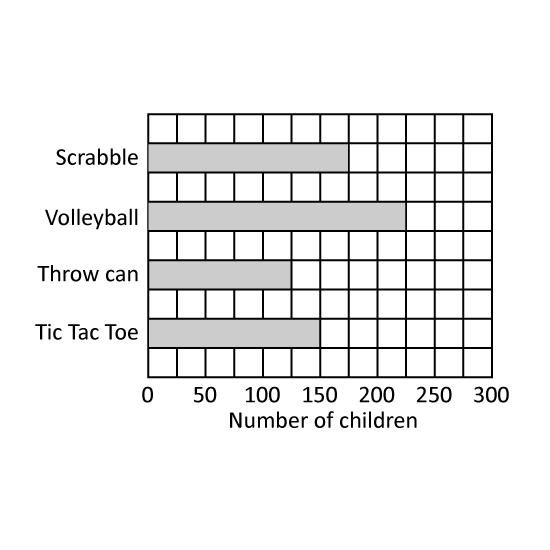
Which game has 125 fans? Write the answer in letter. (Eg A)
(A) Scrabble
(B) Volleyball
(C) Throw Can
(D) Tic Tac Toe
Level 1
Which game has 125 fans? Write the answer in letter. (Eg A)
(A) Scrabble
(B) Volleyball
(C) Throw Can
(D) Tic Tac Toe
Image in this question is not available.
Level 1
The graph shows the favorite sports of children.
(A) Scrabble
(B) Volleyball
(C) Throw Can
(D) Tic Tac Toe
Which sport is the (a) most popular and the (b) least popular? Write the answer in letter. (Eg A)
Level 1
The graph shows the favorite sports of children.
(A) Scrabble
(B) Volleyball
(C) Throw Can
(D) Tic Tac Toe
Which sport is the (a) most popular and the (b) least popular? Write the answer in letter. (Eg A)
Image in this question is not available.
Level 1
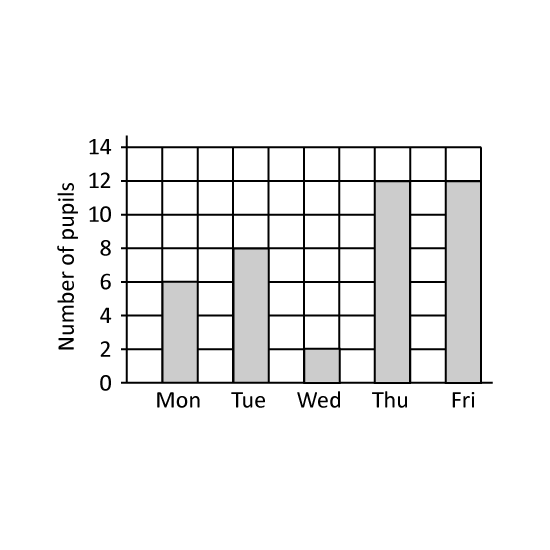
On which two days did an equal number of students visited the library? Give the answers in short form. (Eg Mon, Thu)
Level 1
On which two days did an equal number of students visited the library? Give the answers in short form. (Eg Mon, Thu)
Image in this question is not available.
Level 1
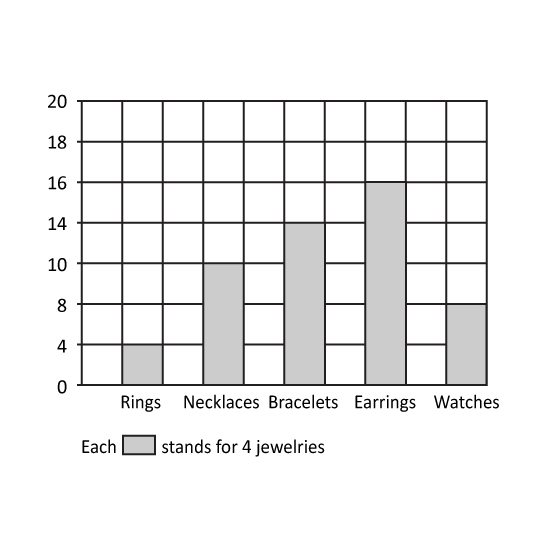
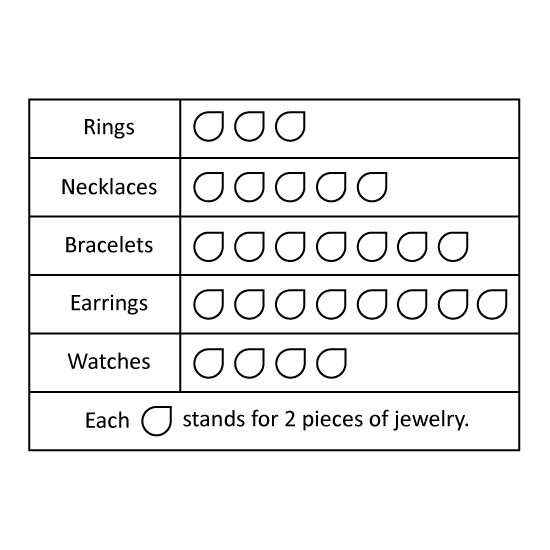
Jenny recorded the number of jewelry at the jewelry shop in the graph as shown. How many necklaces are there?
Level 1
Jenny recorded the number of jewelry at the jewelry shop in the graph as shown. How many necklaces are there?
Image in this question is not available.
Level 1
The graph shows the number of students who visited the library in a week. On which day was the library visited by the least number of students? Give the answer in short form. (Eg Mon)
Level 1
The graph shows the number of students who visited the library in a week. On which day was the library visited by the least number of students? Give the answer in short form. (Eg Mon)
Image in this question is not available.
Level 2
Which 2 games have a total number of 300 fans? Write the answer in letter. (Eg A, B)
(A) Scrabble
(B) Volleyball
(C) Throw Can
(D) Tic Tac Toe
Level 2
Which 2 games have a total number of 300 fans? Write the answer in letter. (Eg A, B)
(A) Scrabble
(B) Volleyball
(C) Throw Can
(D) Tic Tac Toe
Image in this question is not available.
Level 2
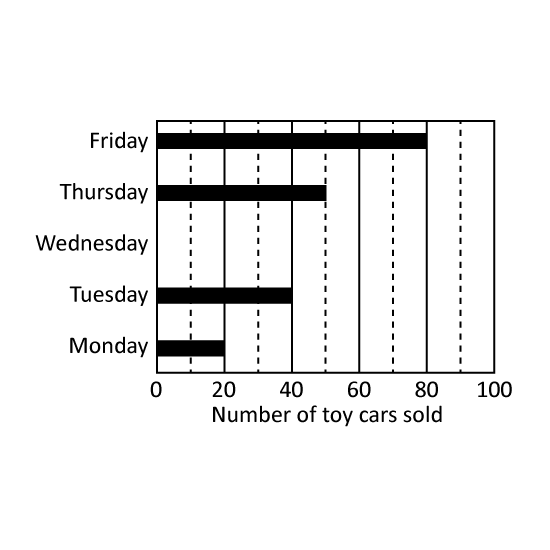
The graph shows the number of toy cars sold in 5 days. Study the graph carefully and use it to answer the following questions.
- 380 cars were sold from Monday to Friday. How many toy cars were sold on Wednesday?
- The number of toy cars sold on Sunday was twice the number sold on Thursday. How many toy cars were sold on Sunday?
Level 2
The graph shows the number of toy cars sold in 5 days. Study the graph carefully and use it to answer the following questions.
- 380 cars were sold from Monday to Friday. How many toy cars were sold on Wednesday?
- The number of toy cars sold on Sunday was twice the number sold on Thursday. How many toy cars were sold on Sunday?
Image in this question is not available.
Level 2
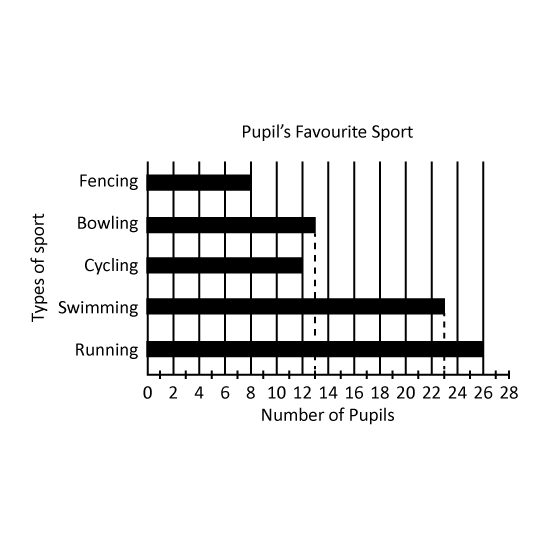
The bar graph shows the types of sport that a group of pupils like. Which sport has twice as many pupils as Bowling?
Level 2
The bar graph shows the types of sport that a group of pupils like. Which sport has twice as many pupils as Bowling?
Image in this question is not available.
Level 2
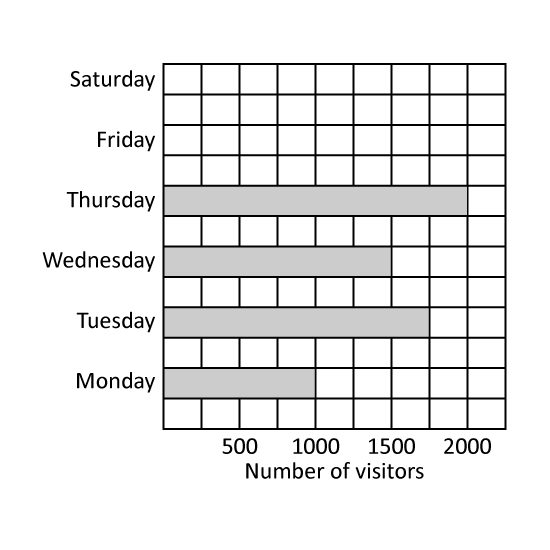
The graph shows the number of visitors to the museum. On which days were there twice as many visitors as on Monday? Give the answer in short form. (Eg Mon)
Level 2
The graph shows the number of visitors to the museum. On which days were there twice as many visitors as on Monday? Give the answer in short form. (Eg Mon)
Image in this question is not available.
Level 2
The graph shows the number of visitors to the amusement park. 2 times as many visitors visited the amusement park on Friday as on Monday. How many visitors visited the amusement park on Friday?
Level 2
The graph shows the number of visitors to the amusement park. 2 times as many visitors visited the amusement park on Friday as on Monday. How many visitors visited the amusement park on Friday?
Image in this question is not available.
Level 2
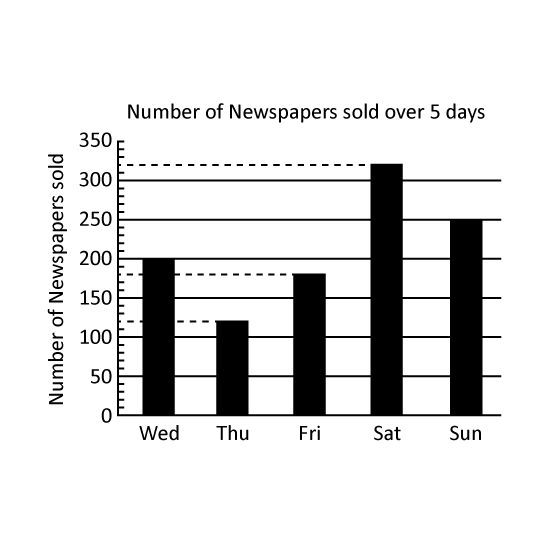
The bar graph shows the number of newspapers sold over a period of 5 days.
- On which day was the least number of newspapers sold?
- How many more newspapers were sold on Sunday than on Friday?
Level 2
The bar graph shows the number of newspapers sold over a period of 5 days.
- On which day was the least number of newspapers sold?
- How many more newspapers were sold on Sunday than on Friday?
Image in this question is not available.
Level 2
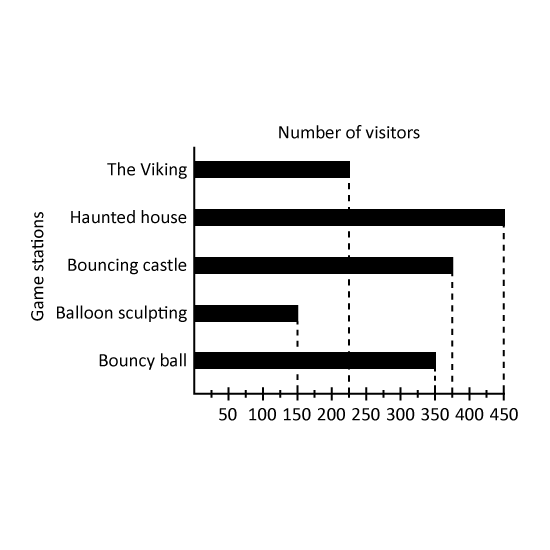
The bar graph shows the number of visitors at the different games stations at a carnival.
- Which games station has only half the number of visitors as the 'haunted house'
- How many visitors were at the 'Bouncing Castle' and 'Balloon Sculpting' altogether?
Level 2
The bar graph shows the number of visitors at the different games stations at a carnival.
- Which games station has only half the number of visitors as the 'haunted house'
- How many visitors were at the 'Bouncing Castle' and 'Balloon Sculpting' altogether?
Image in this question is not available.
Level 2
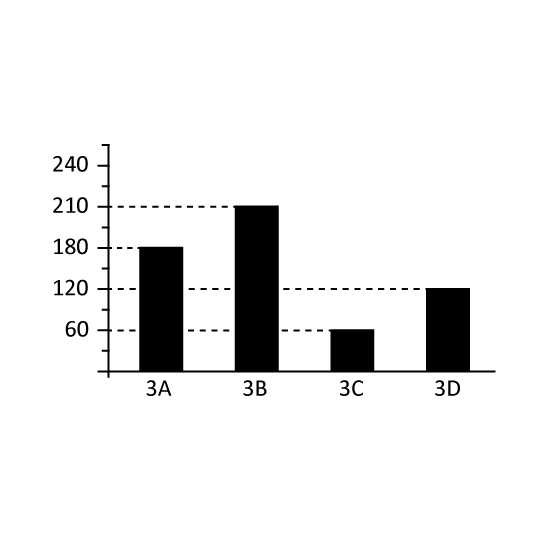
The bar graph shows the number of books Primary 3 students read over a week.
- Class __ and ___ read 240 books in total.
- For every 3 books read by the students, they can exchange for 1 gift. How many more gifts did Class 3B exchange than Class 3C?
Level 2
The bar graph shows the number of books Primary 3 students read over a week.
- Class __ and ___ read 240 books in total.
- For every 3 books read by the students, they can exchange for 1 gift. How many more gifts did Class 3B exchange than Class 3C?
Image in this question is not available.
Level 2
The bar graph shows the number of children who like a game. How many more children like tic tac toe than volleyball?
Level 2
The bar graph shows the number of children who like a game. How many more children like tic tac toe than volleyball?
Image in this question is not available.
Level 2
The graph shows the number of students who visited the library. How many more students visited the library on Friday more than on Wednesday?
Level 2
The graph shows the number of students who visited the library. How many more students visited the library on Friday more than on Wednesday?
Image in this question is not available.
Level 2
The graph shows the number of students who visited the library. 500 fewer students visited the library on Saturday than on Monday. How many students visited the amusement park on Saturday?
Level 2
The graph shows the number of students who visited the library. 500 fewer students visited the library on Saturday than on Monday. How many students visited the amusement park on Saturday?
Image in this question is not available.
Level 2
The graph shows the number of children who visited the amusement park. How many more children visited the amusement park on Wednesday than on Monday?
Level 2
The graph shows the number of children who visited the amusement park. How many more children visited the amusement park on Wednesday than on Monday?
Image in this question is not available.
Level 2
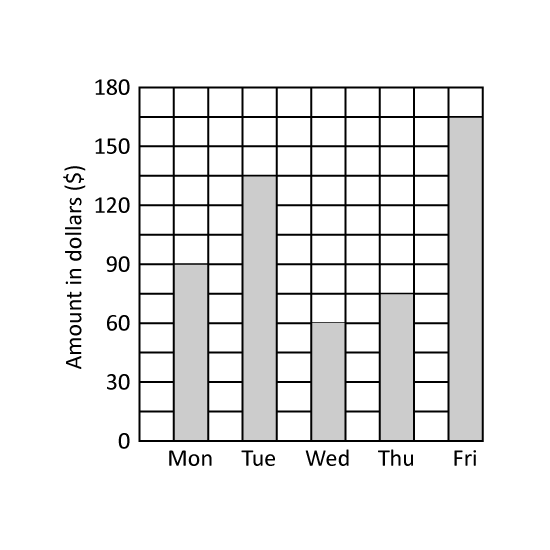
The graph shows how much Mary earned from Monday to Friday. The total amount Mary earned on two of the days is the same as what she earned on Tuesday. Which were the two days? Give the answers in short form. (Eg Mon, Thu)
Level 2
The graph shows how much Mary earned from Monday to Friday. The total amount Mary earned on two of the days is the same as what she earned on Tuesday. Which were the two days? Give the answers in short form. (Eg Mon, Thu)
Image in this question is not available.
Level 2
The graph shows the number of children who visited the amusement park from Monday to Saturday. Each entrance ticket to the amusement park was sold at $9. How much money was collected on Wednesday?
Level 2
The graph shows the number of children who visited the amusement park from Monday to Saturday. Each entrance ticket to the amusement park was sold at $9. How much money was collected on Wednesday?
Image in this question is not available.
Level 2
If the cleaning fee for each jewelry is $2, what is the total amount collected from all the pieces of jewellery?
Level 2
If the cleaning fee for each jewelry is $2, what is the total amount collected from all the pieces of jewellery?
Image in this question is not available.