Level 1
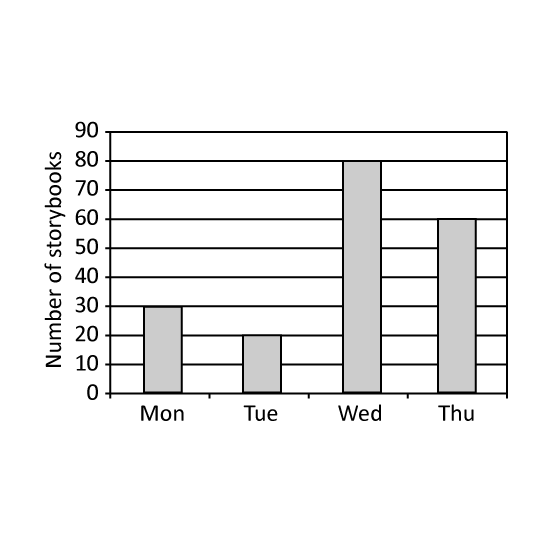
The graph shows the number of story books borrowed from a library over 4 days. What is the total number of story books borrowed from Monday to Thursday?
Level 1
The graph shows the number of story books borrowed from a library over 4 days. What is the total number of story books borrowed from Monday to Thursday?
Image in this question is not available.
Level 1
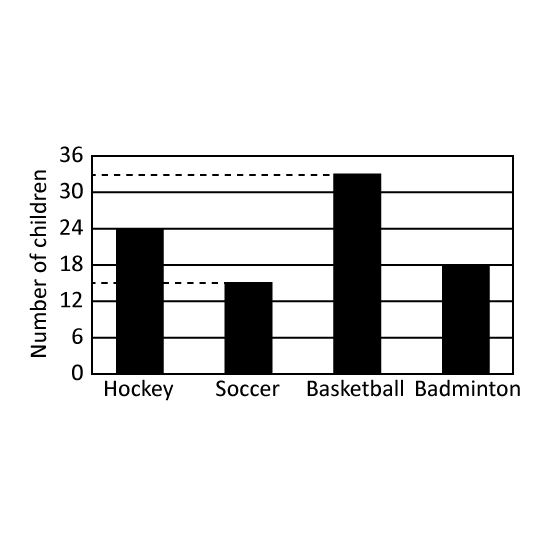
The graph shows the types of sports that children play in a primary school. What percentage of the children play badminton?
Level 1
The graph shows the types of sports that children play in a primary school. What percentage of the children play badminton?
Image in this question is not available.
Level 1
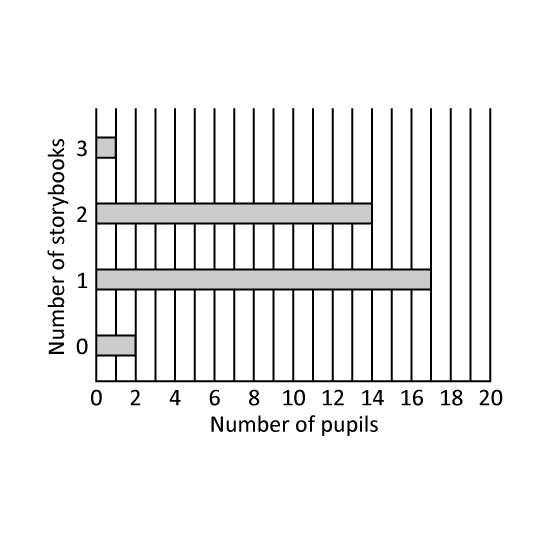
The graph shows the number of books borrowed by 40 pupils in a class.
How many pupils borrowed 4 storybooks?
Level 1
The graph shows the number of books borrowed by 40 pupils in a class.
How many pupils borrowed 4 storybooks?
Image in this question is not available.
Level 1
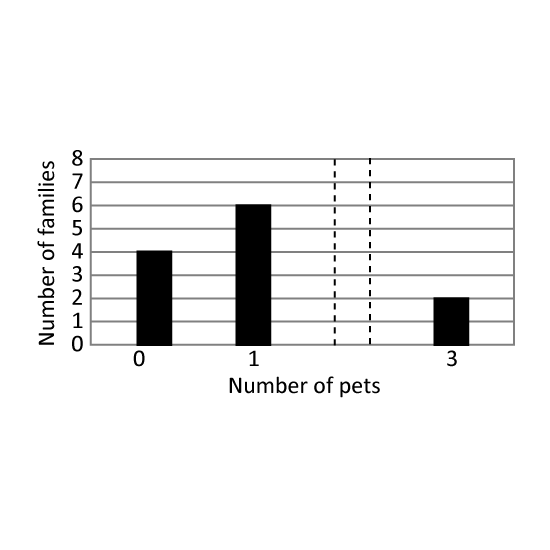
The bar graph shows the number of pets owned by the families living in a block of flats. There are a total of 20 pets in the block. The bar that shows the number of families that has 2 pets is not drawn. How many families have 2 pets?
Level 1
The bar graph shows the number of pets owned by the families living in a block of flats. There are a total of 20 pets in the block. The bar that shows the number of families that has 2 pets is not drawn. How many families have 2 pets?
Image in this question is not available.
Level 1
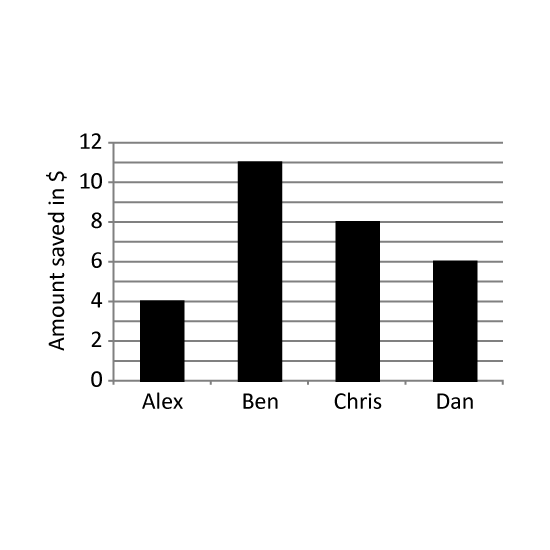
Four friends were given a sum of $25 each. The bar graph shows the amount of money saved by each of them in the week. How much did they spend together?
Level 1
Four friends were given a sum of $25 each. The bar graph shows the amount of money saved by each of them in the week. How much did they spend together?
Image in this question is not available.
Level 1
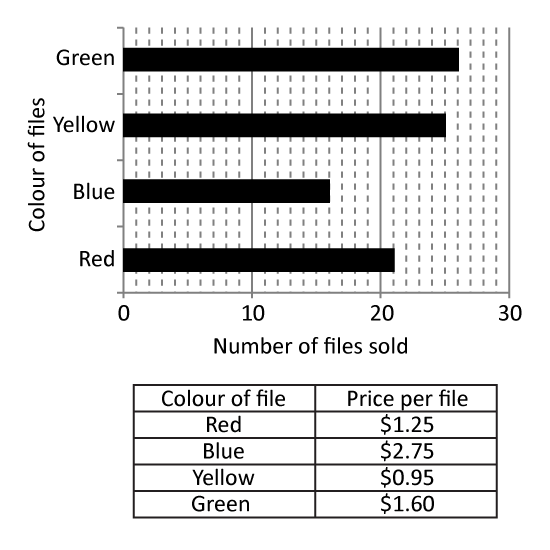
The bar graph shows the number of files sold by a bookshop on a Friday.
- Which coloured file did the shop collect the most money from the sale? Give the first letter of the answer. (Eg Blue = B)
- What was the amount of money collected from (a)?
Level 1
The bar graph shows the number of files sold by a bookshop on a Friday.
- Which coloured file did the shop collect the most money from the sale? Give the first letter of the answer. (Eg Blue = B)
- What was the amount of money collected from (a)?
Image in this question is not available.
Level 2
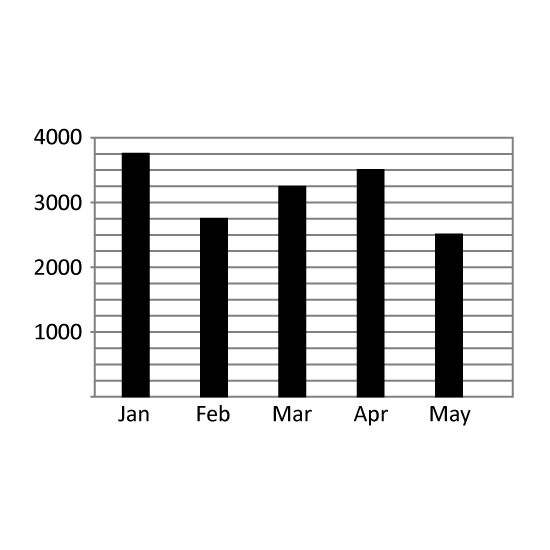
The graph shows the earnings that an apparel store made from January to May.
- What was the total earnings from January to May?
- How much money must be earned in June to have an average earnings of $3200 from January to June?
Level 2
The graph shows the earnings that an apparel store made from January to May.
- What was the total earnings from January to May?
- How much money must be earned in June to have an average earnings of $3200 from January to June?
Image in this question is not available.
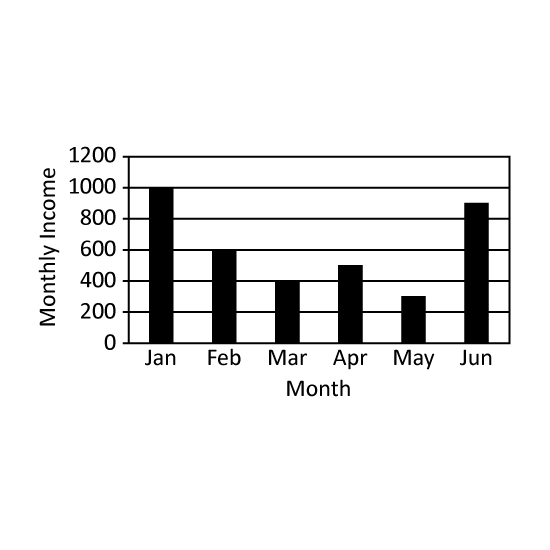
Level 2
The graph shows the monthly income of Mr Chai for the first half of the year. In which month was his income 35 of her combined income in January and April? Give the answer in short form. (Eg Jan)
Level 2
The graph shows the monthly income of Mr Chai for the first half of the year. In which month was his income 35 of her combined income in January and April? Give the answer in short form. (Eg Jan)
Image in this question is not available.
Level 2
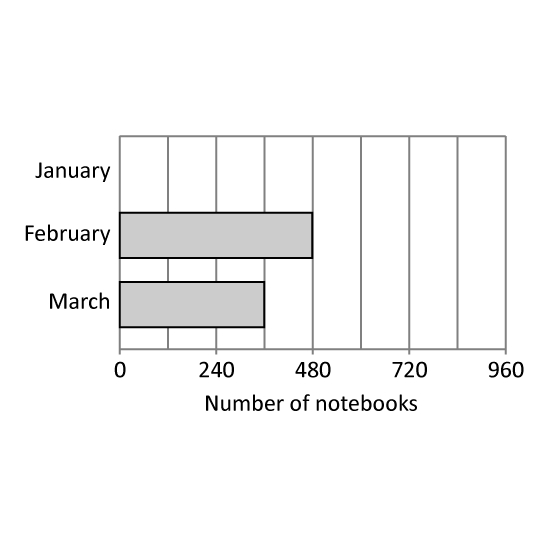
The bar graph shows the number of notebooks sold in 3 months. The bar that shows the number of notebooks in January is not drawn.
38 of the total number of notebooks sold in the 3 months were sold in January. How many notebooks were sold in January?
Level 2
The bar graph shows the number of notebooks sold in 3 months. The bar that shows the number of notebooks in January is not drawn.
38 of the total number of notebooks sold in the 3 months were sold in January. How many notebooks were sold in January?
Image in this question is not available.
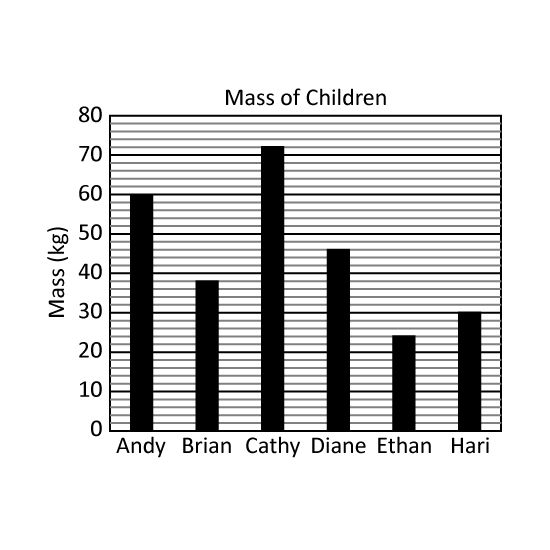
Level 2
The graph shows the mass of 6 children in kilograms.
- Who is three times as heavy as Ethan? Give the first letter of the answer. (Eg Apple = A)
- What is the total mass of the 3 heaviest children?
Level 2
The graph shows the mass of 6 children in kilograms.
- Who is three times as heavy as Ethan? Give the first letter of the answer. (Eg Apple = A)
- What is the total mass of the 3 heaviest children?
Image in this question is not available.
Level 2
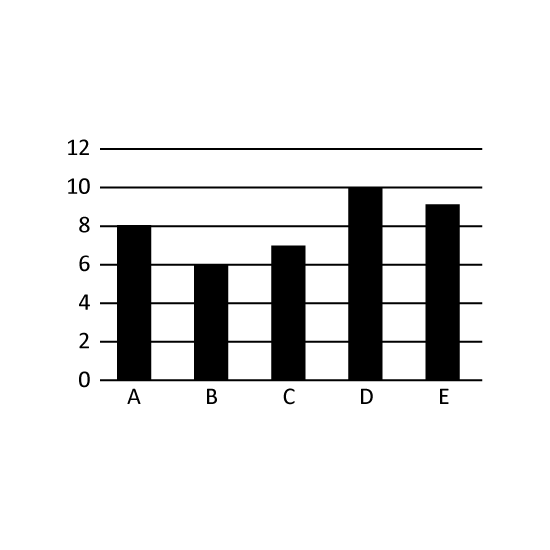
The bar graph shows the number of students in each class. How many more students are in Class D than in Class C? Express it as a percentage of the total number of students in all the classes.
Level 2
The bar graph shows the number of students in each class. How many more students are in Class D than in Class C? Express it as a percentage of the total number of students in all the classes.
Image in this question is not available.
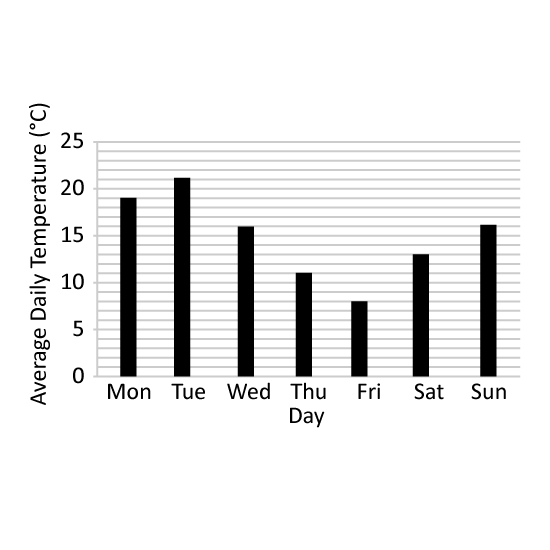
Level 1
The bar graph shows the average daily temperature experienced by Country A in a week. What was the difference in the highest and lowest average daily temperatures in that week?
Level 1
The bar graph shows the average daily temperature experienced by Country A in a week. What was the difference in the highest and lowest average daily temperatures in that week?
Image in this question is not available.
Level 2
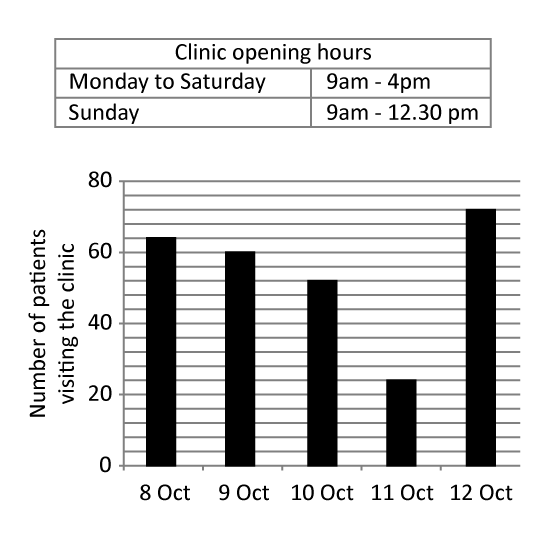
The bar graph shows the number of patients visiting a clinic during a period of time. The average number of patients visiting the clinic is 8 patients per hour.
- Which date is most probably a Sunday?
- What is the total number of patients visiting the clinic from 8 October to 12 October?
Level 2
The bar graph shows the number of patients visiting a clinic during a period of time. The average number of patients visiting the clinic is 8 patients per hour.
- Which date is most probably a Sunday?
- What is the total number of patients visiting the clinic from 8 October to 12 October?
Image in this question is not available.
Level 3
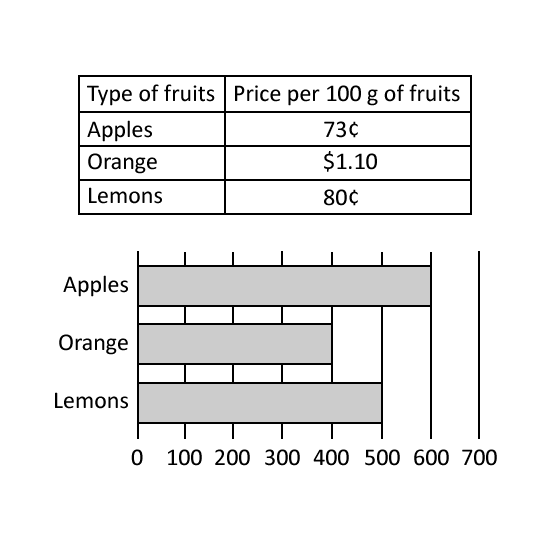
Sandra bought three types of fruits. The prices are given.
The bar graph shows the mass of each type of fruits Sandra bought.
- What fraction of the fruits Sandra bought were cucumber? Give your answer in the simplest form.
- Which type of fruits did Sandra spend the most money on? How much did she spend on that fruits? Give your answers in this format. (Eg 1, $1.20)
Level 3
Sandra bought three types of fruits. The prices are given.
The bar graph shows the mass of each type of fruits Sandra bought.
- What fraction of the fruits Sandra bought were cucumber? Give your answer in the simplest form.
- Which type of fruits did Sandra spend the most money on? How much did she spend on that fruits? Give your answers in this format. (Eg 1, $1.20)
Image in this question is not available.
Level 2
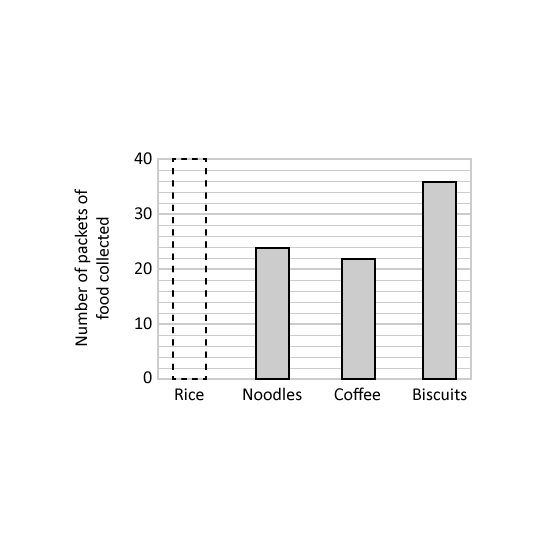
The bar graph shows the number of packets of different food collected in a donation drive.
- 15 of the total number of packets of food collected was coffee. How many packets of rice were collected?
- The table shows the mass of each packet of food. What is the difference between the total mass of noodles collected and the total mass of biscuits collected? Give your answer in kg.
Level 2
The bar graph shows the number of packets of different food collected in a donation drive.
- 15 of the total number of packets of food collected was coffee. How many packets of rice were collected?
- The table shows the mass of each packet of food. What is the difference between the total mass of noodles collected and the total mass of biscuits collected? Give your answer in kg.
Image in this question is not available.
Level 3
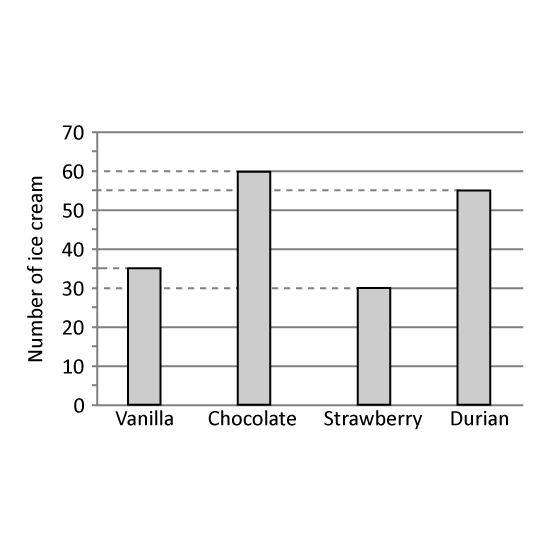
The bar graph shows the number of ice-cream flavours sold at a shop in a day.
- What percentage of the ice-creams sold was durian ice-creams? Give your answer correct to 1 decimal place.
- The cost of each ice-cream was the same. The amount of money collected for vanilla ice-creams was $15 more than the amount of money collected for strawberry ice-creams. What was the total amount of money collected from the sale of all the ice-creams?
Level 3
The bar graph shows the number of ice-cream flavours sold at a shop in a day.
- What percentage of the ice-creams sold was durian ice-creams? Give your answer correct to 1 decimal place.
- The cost of each ice-cream was the same. The amount of money collected for vanilla ice-creams was $15 more than the amount of money collected for strawberry ice-creams. What was the total amount of money collected from the sale of all the ice-creams?
Image in this question is not available.
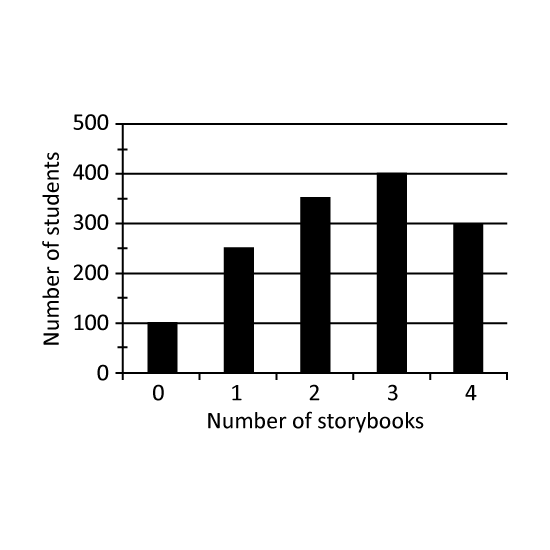
Level 3
The bar graph shows the number of storybooks read by the students in a school.
- How many students are there in the school?
- What percentage of the students in the school read at least 1 storybook? (Give the answer correct to the nearest whole number.)
Level 3
The bar graph shows the number of storybooks read by the students in a school.
- How many students are there in the school?
- What percentage of the students in the school read at least 1 storybook? (Give the answer correct to the nearest whole number.)
Image in this question is not available.