Level 1
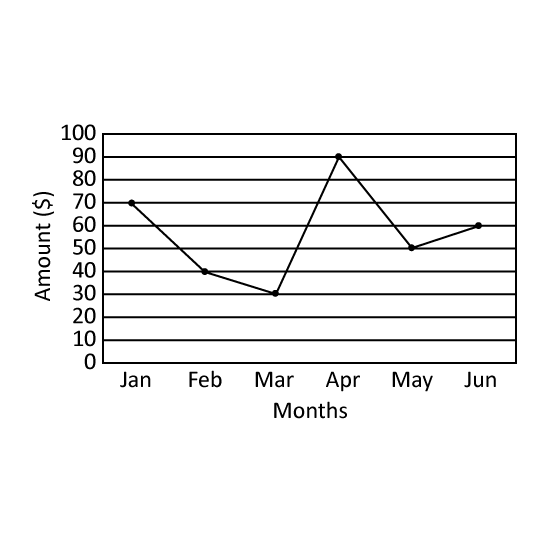
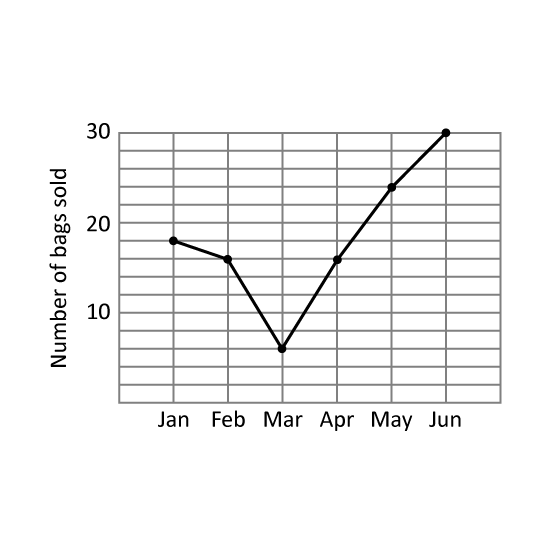
The line graph shows the amount of utility bills paid by Mr Gann's household in the first six months of the year. In which month did the greatest decrease in utility bills occur? Give the answer in short form. (Eg Jan)
Level 1
The line graph shows the amount of utility bills paid by Mr Gann's household in the first six months of the year. In which month did the greatest decrease in utility bills occur? Give the answer in short form. (Eg Jan)
Level 3
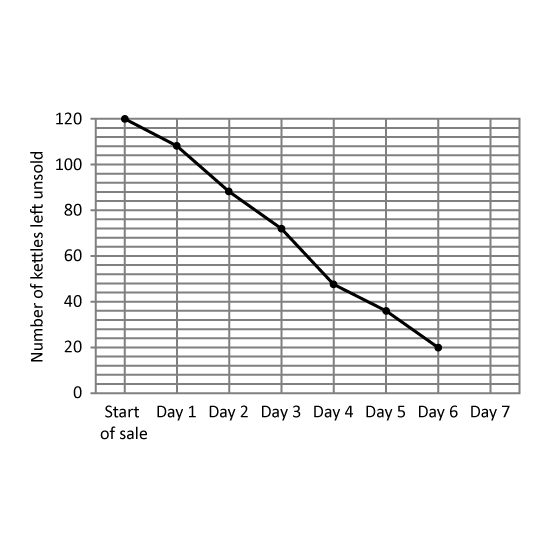
A departmental store had 120 kettles for sale during a 7-day period. The line graph shows the number of kettles left unsold at the end of each day. The number of kettles left unsold at the end of Day 7 was not shown.
On which day (from Day 1 to Day 7), was the greatest number of kettles sold? Give your answer in number. (Eg 1)
The average number of kettles sold for the last three days was 14. How many kettles were sold on Day 7?
Level 3
A departmental store had 120 kettles for sale during a 7-day period. The line graph shows the number of kettles left unsold at the end of each day. The number of kettles left unsold at the end of Day 7 was not shown.
On which day (from Day 1 to Day 7), was the greatest number of kettles sold? Give your answer in number. (Eg 1)
The average number of kettles sold for the last three days was 14. How many kettles were sold on Day 7?