Level 2
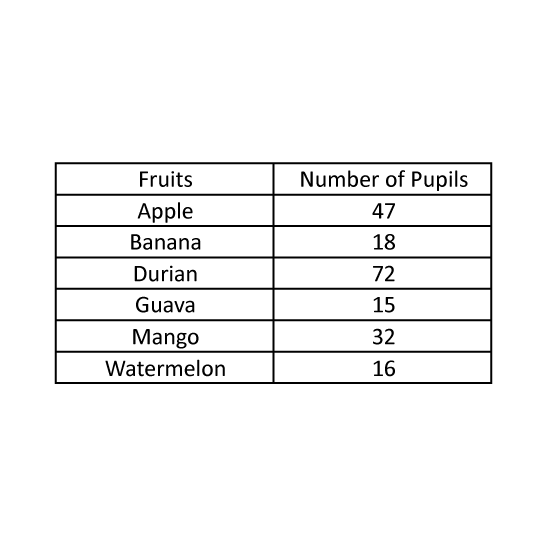
The table shows the survey results of the favourite fruits for some pupils. What is the percentage of pupils who chose the two most popular fruits?
Level 2
The table shows the survey results of the favourite fruits for some pupils. What is the percentage of pupils who chose the two most popular fruits?
Level 3
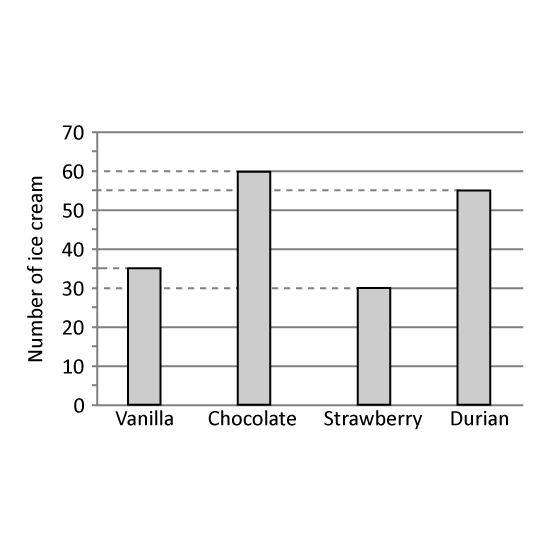
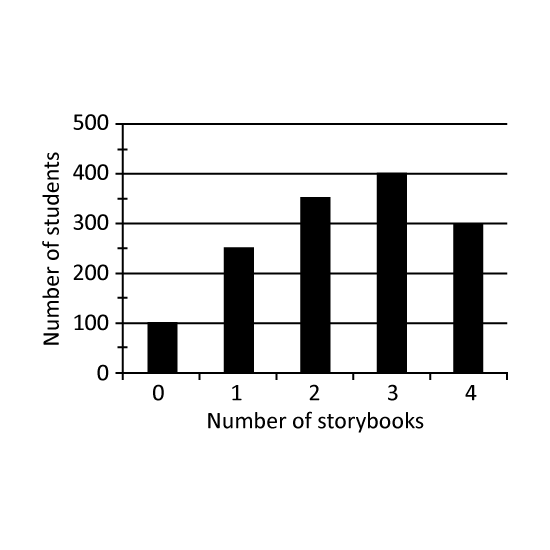
The bar graph shows the number of ice-cream flavours sold at a shop in a day.
What percentage of the ice-creams sold was durian ice-creams? Give your answer correct to 1 decimal place.
The cost of each ice-cream was the same. The amount of money collected for vanilla ice-creams was $15 more than the amount of money collected for strawberry ice-creams. What was the total amount of money collected from the sale of all the ice-creams?
Level 3
Eli had 60 red beads and 40 green beads. Eli gave away 30% of her red beads and 55% of her green beads. What percentage of her beads left was green?
Level 3
60% of the sweets in Packet A were blueberry sweets and the rest were strawberry sweets. Packet B had 25% more blueberry sweets than packet A and twice as many sweets than the total number of sweets in Packet A. Find the percentage of the strawberry sweets in Packet B that would need to be transferred into Packet A, so that there were an equal number of blueberry and strawberry sweets in Packet A.