Level 3
The line graph shows the total number of cars sold by a car dealer in the first six months of the year.
In which two months were there a consecutive increase in the number of cars sold? Give the answer in short form. (Eg Jan, Feb)
What fraction of the cars was sold in the month of the lowest sale?
The car dealer was paid a fixed amount of money for every car he sold. He received $3200 more in April than in February. How much money did he receive from selling a car?
Level 3 PSLE
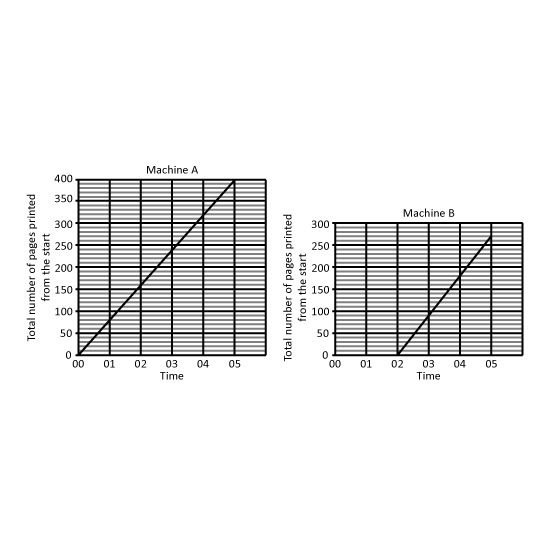
Mr Lee used two printers with different printing rates for a printing job. He started Machine A at 10 00 and started Machine B two minutes later.
He stopped both machines at 10 05.
The graphs show the total number of pages printed by each machine from the start of printing.
How many pages had been printed by Machine A at the time Mr Lee started Machine B?
What was the difference in the number of pages printed by the two machines from 10 00 to 10 05?
Which machine, A or B, has a faster printing rate? What is the difference in the number of pages printed by the machines in one minute? Give your answer in this format. (Eg A, 1)
Level 3 PSLE
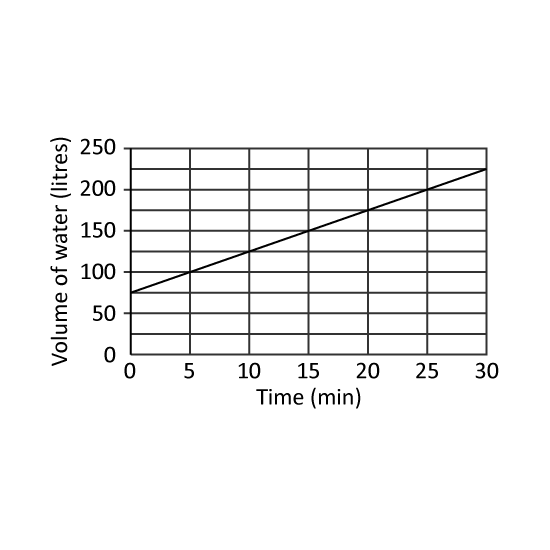
At first, 18 of a tank was filled with water. A tap was turned on for 30 min for more water to flow into the tank. It was then turned off. The line graph shows the volume of water in the tank over the 30 min.
How many litres of water flowed into the tank in one minute?
At the end of 30 min, what fraction of the tank was filled with water?
The tap was turned on again to fill up the tank at the same rate as before. How many more minutes did it take for the tank to be filled completely?
Level 3 PSLE
At first, 18 of a tank was filled with water. A tap was turned on for 30 min for more water to flow into the tank. It was then turned off. The line graph shows the volume of water in the tank over the 30 min.
How many litres of water flowed into the tank in one minute?
At the end of 30 min, what fraction of the tank was filled with water?
The tap was turned on again to fill up the tank at the same rate as before. How many more minutes did it take for the tank to be filled completely?