Level 1 PSLE
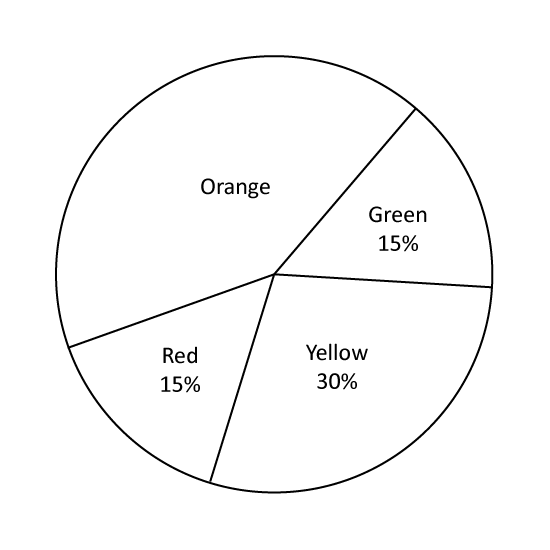
The pie chart shows the favourite colours of a group of pupils. What percentage of the pupils choose orange as their favourite colour?
Level 1 PSLE
The pie chart shows the favourite colours of a group of pupils. What percentage of the pupils choose orange as their favourite colour?
Image in this question is not available.
Level 1 PSLE
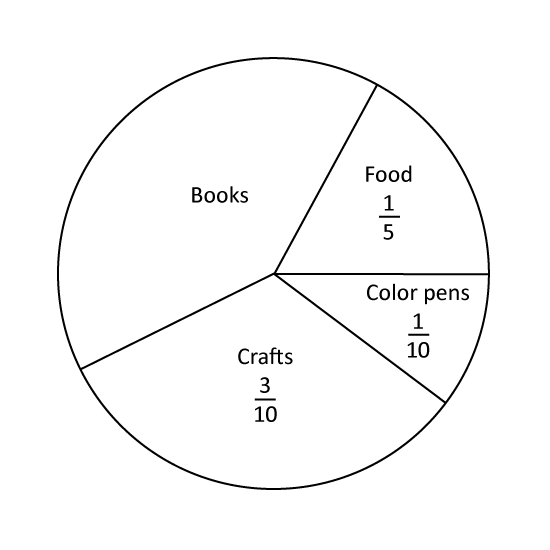
The pie chart shows how Jenny spent her pocket money last month. What is the ratio of the amount of money Jenny spent on crafts to the amount she spent on books?
Level 1 PSLE
The pie chart shows how Jenny spent her pocket money last month. What is the ratio of the amount of money Jenny spent on crafts to the amount she spent on books?
Image in this question is not available.
Level 1 PSLE
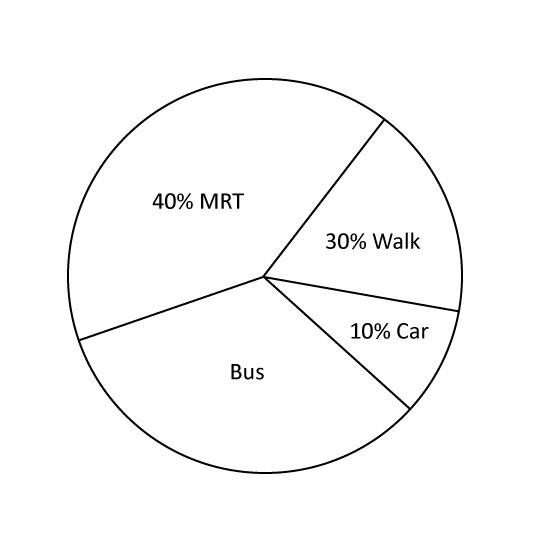
The pie chart shows the different ways a group of workers go to work. What is the ratio of number of workers who walk to work to the number who go by bus?
Level 1 PSLE
The pie chart shows the different ways a group of workers go to work. What is the ratio of number of workers who walk to work to the number who go by bus?
Image in this question is not available.
Level 2 PSLE
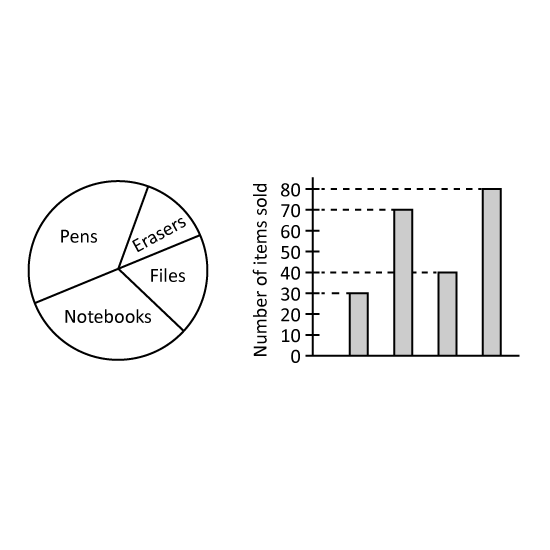
The pie chart shows the number of pens, erasers, file and notebook sold by a shop. The same information is shown in a bar graph, but the names of the items are not shown on the bar graph. How many less erasers than pens are sold?
Level 2 PSLE
The pie chart shows the number of pens, erasers, file and notebook sold by a shop. The same information is shown in a bar graph, but the names of the items are not shown on the bar graph. How many less erasers than pens are sold?
Image in this question is not available.
Level 1 PSLE
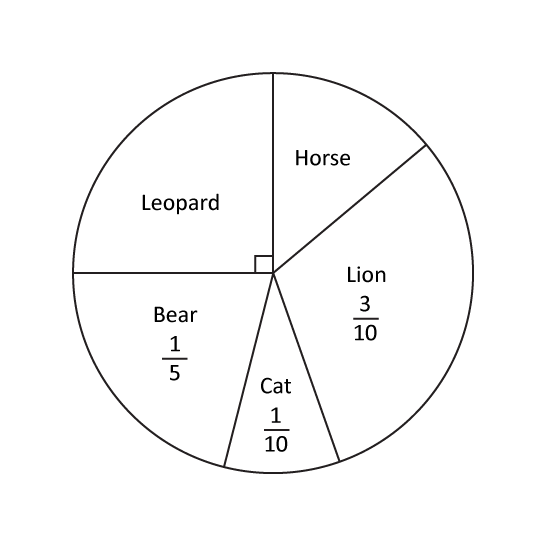
In a class, each pupil chose one animal for their class banner. The pie chart shows their choices. What fraction of the class chose Horse?
Level 1 PSLE
In a class, each pupil chose one animal for their class banner. The pie chart shows their choices. What fraction of the class chose Horse?
Image in this question is not available.
Level 2
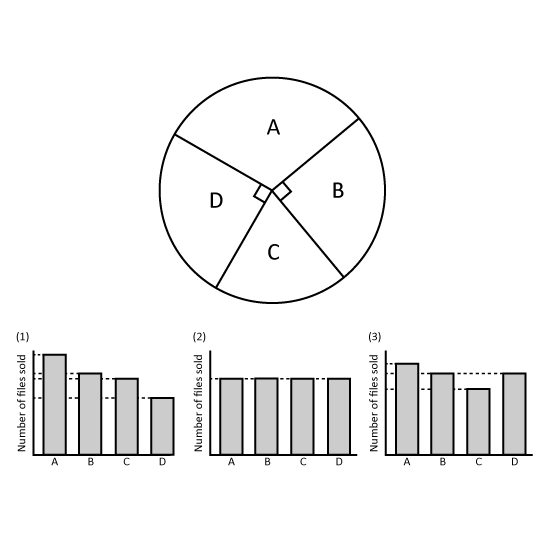
The pie chart shows the number of three types of files sold by a bookstore last week. Which bar graph best represents the information in the pie chart? Give your answer in number. (Eg 1)
Level 2
The pie chart shows the number of three types of files sold by a bookstore last week. Which bar graph best represents the information in the pie chart? Give your answer in number. (Eg 1)
Image in this question is not available.
Level 1 PSLE
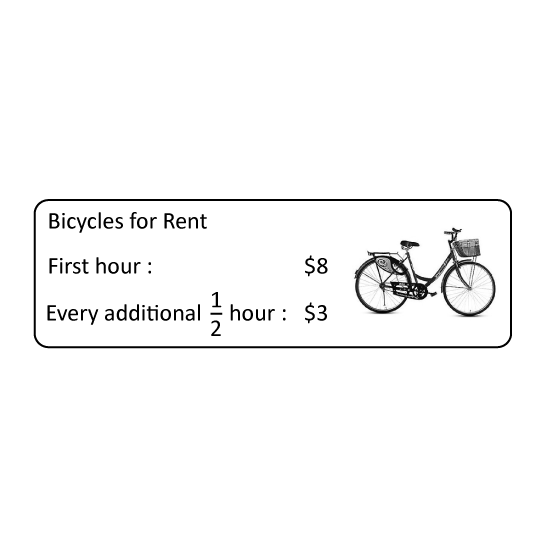
The table shows the charges for bicycle rental. Colin rented a bicycle for 3 hours. How much did he pay?
Level 1 PSLE
The table shows the charges for bicycle rental. Colin rented a bicycle for 3 hours. How much did he pay?
Image in this question is not available.
Level 1 PSLE
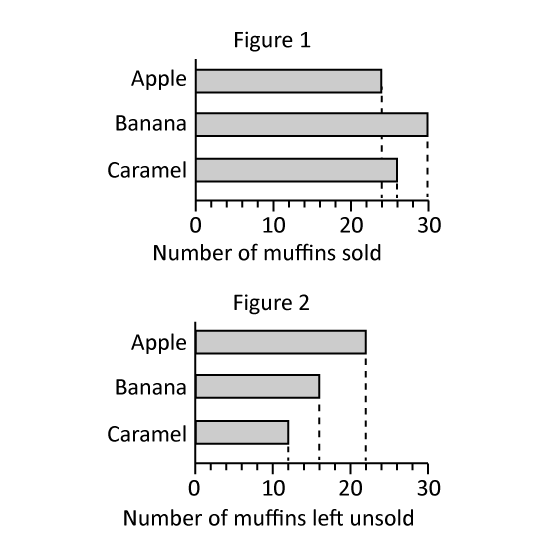
Jen baked some muffins to sell at a funfair. Figure 1 shows the number of muffins that was sold. Figure 2 shows the number of muffins left unsold at the end of the funfair.
- What was the number of caramel muffins Jen baked?
- Altogether, how many apples and banana muffins were left unsold after the funfair?
Level 1 PSLE
Jen baked some muffins to sell at a funfair. Figure 1 shows the number of muffins that was sold. Figure 2 shows the number of muffins left unsold at the end of the funfair.
- What was the number of caramel muffins Jen baked?
- Altogether, how many apples and banana muffins were left unsold after the funfair?
Image in this question is not available.
Level 1 PSLE
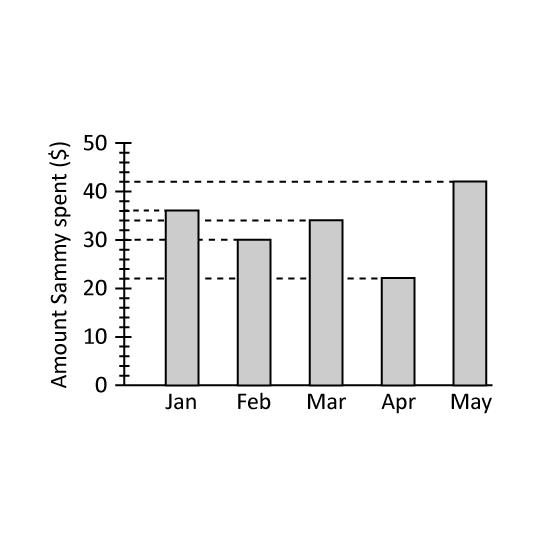
The bar graph shows the amount of pocket money Sammy spent each month from January to May.
- How much more money did Sammy spend in March than in April?
- Which months did Sammy spent more than $35? Give your answers in numbers in ascending order. (Eg Jan & Feb = 1, 2)
Level 1 PSLE
The bar graph shows the amount of pocket money Sammy spent each month from January to May.
- How much more money did Sammy spend in March than in April?
- Which months did Sammy spent more than $35? Give your answers in numbers in ascending order. (Eg Jan & Feb = 1, 2)
Image in this question is not available.
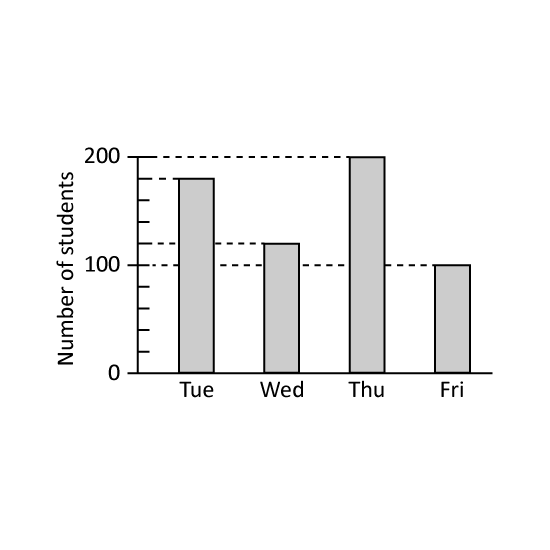
Level 1 PSLE
A school conducted checks on its Primary 6 students' eyesight from Tuesday to Friday. Each student had their eyes checked on one of the four days. The bar graph shows the number of students that were checked on each day. What percentage of the Primary 6 students had their eyes checked on Tuesday?
Image in this question is not available.