Level 2
Look at the picture graph.
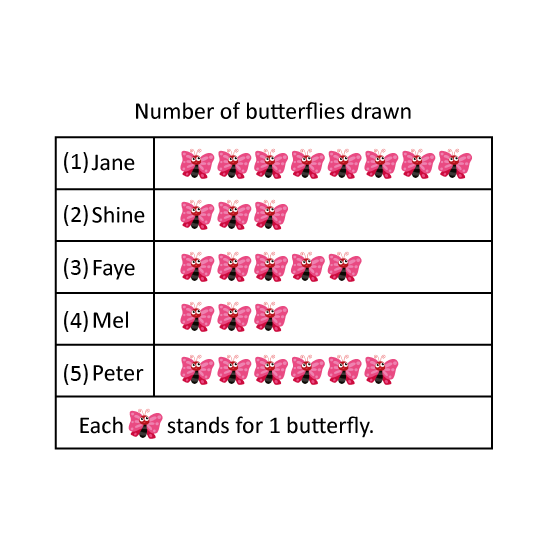
This graph shows the number of butterflies drawn by each child.
Give the answers in numbers. (Eg 1)
- Who draw the same number of butterflies as Shine?
- Which 2 children draw a total of 13 butterflies? (Eg 1, 2)
- Who draws 3 more butterflies than Mel?
- Faye and his neighbour draw 3 butterflies more than Jane. Who is this neighbour?
Level 2
Look at the picture graph.
This graph shows the number of butterflies drawn by each child.
Give the answers in numbers. (Eg 1)
- Who draw the same number of butterflies as Shine?
- Which 2 children draw a total of 13 butterflies? (Eg 1, 2)
- Who draws 3 more butterflies than Mel?
- Faye and his neighbour draw 3 butterflies more than Jane. Who is this neighbour?
Image in this question is not available.
Level 1 PSLE
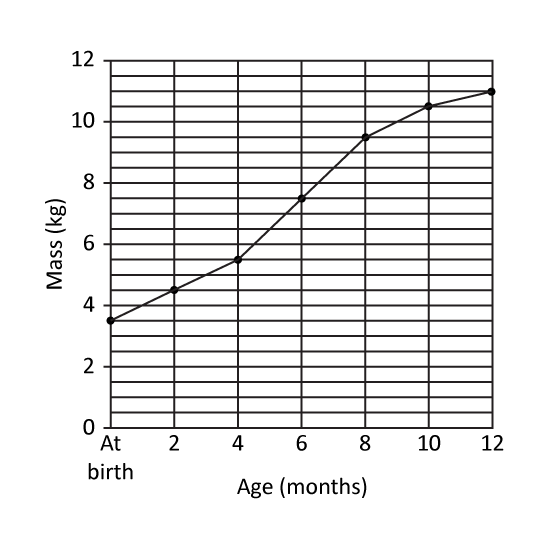
The line graph shows Kenneth's mass from birth to his first birthday. At what age was Kenneth's mass 3 times his mass at birth? _____ months
Level 1 PSLE
The line graph shows Kenneth's mass from birth to his first birthday. At what age was Kenneth's mass 3 times his mass at birth? _____ months
Image in this question is not available.
Level 1
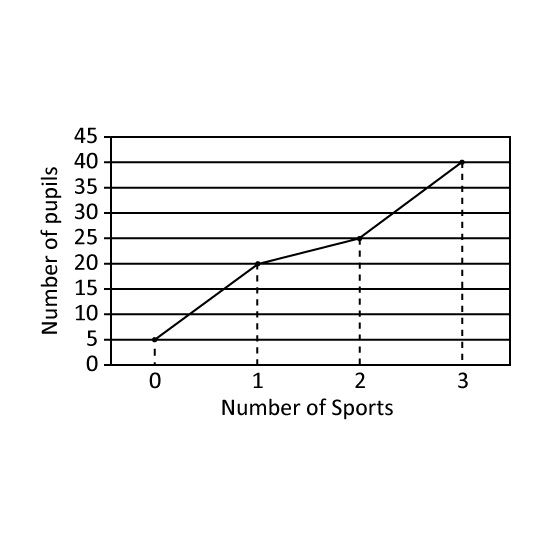
The graph shows the number of sports that a group of pupils participated in. How many pupils participated in at least 1 sport?
Level 1
The graph shows the number of sports that a group of pupils participated in. How many pupils participated in at least 1 sport?
Image in this question is not available.
Level 2
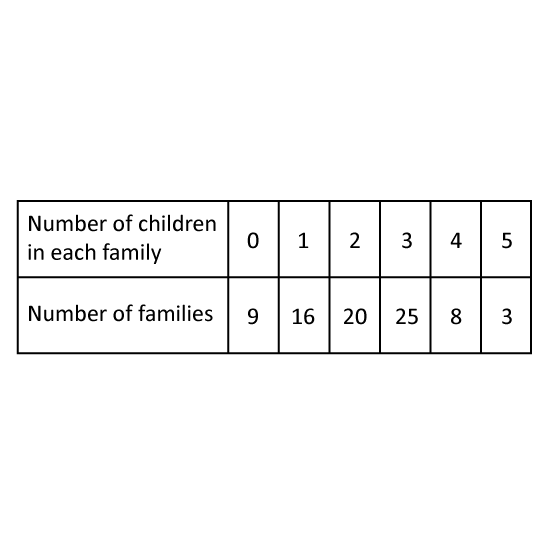
The table shows the number of children in each family in a neighbourhood. How many families have more than 3 children?
Level 2
The table shows the number of children in each family in a neighbourhood. How many families have more than 3 children?
Image in this question is not available.
Level 1 PSLE
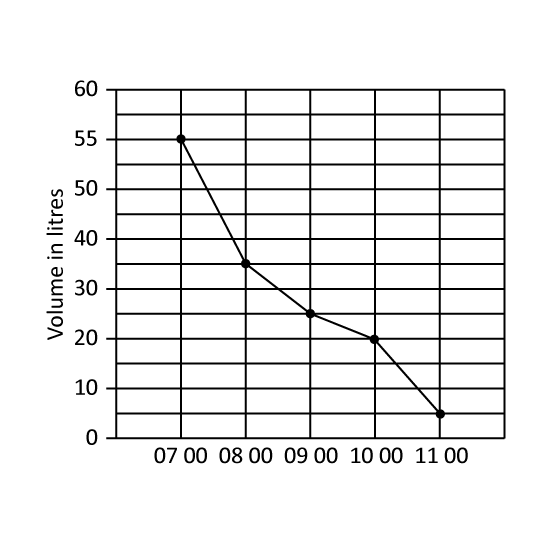
A tank was filled with 55 litre of water at 07 00. Water flowed out of the tank from 07 00 to 11 00. The line graph shows the amount of water in the tank from 07 00 to 11 00.
During which one-hour period was the decrease in the volume of water the greatest?
Give your answer in number. (Eg 1)
(1) From 0700 to 0800
(2) From 0700 to 0900
(3) From 0900 to 1000
(4) From 1000 to 1100
Level 1 PSLE
A tank was filled with 55 litre of water at 07 00. Water flowed out of the tank from 07 00 to 11 00. The line graph shows the amount of water in the tank from 07 00 to 11 00.
During which one-hour period was the decrease in the volume of water the greatest?
Give your answer in number. (Eg 1)
(1) From 0700 to 0800
(2) From 0700 to 0900
(3) From 0900 to 1000
(4) From 1000 to 1100
Image in this question is not available.
Level 1 PSLE
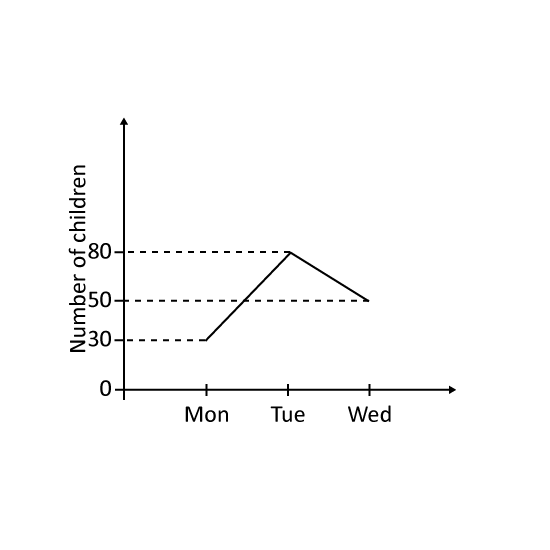
The graph shows the number of children at the camp from Monday to Wednesday. The number of children at a club increased by (a) _____ from Monday to Tuesday and decreased by (b) _____ from Tuesday to Wednesday.
Level 1 PSLE
The graph shows the number of children at the camp from Monday to Wednesday. The number of children at a club increased by (a) _____ from Monday to Tuesday and decreased by (b) _____ from Tuesday to Wednesday.
Image in this question is not available.
Level 1
3 boys and 4 girls have a total of 840 stamps. What is the average number of stamps each child has?
1 m
Image in this question is not available.
Level 3
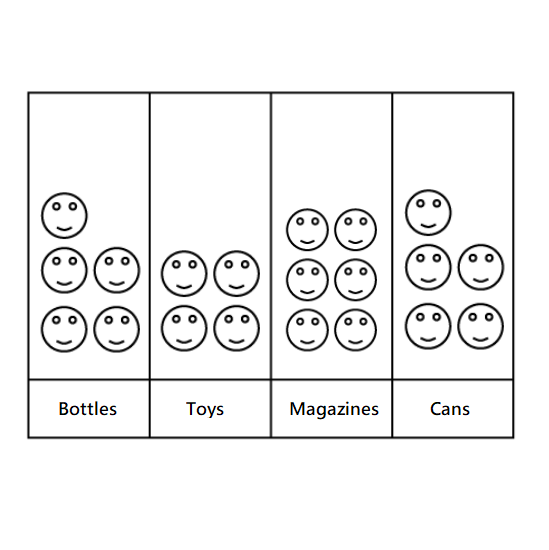
Look at the picture graph.
This graph shows 4 item types that John collected for his recycling project. Give the answers in numbers.
- John collected _____ magazines.
- He collected _____ more magazine than toys.
- He collected the same number of _____ and _____ . (Eg 1, 2)
- He collected _____ items altogether.
Level 3
Look at the picture graph.
This graph shows 4 item types that John collected for his recycling project. Give the answers in numbers.
- John collected _____ magazines.
- He collected _____ more magazine than toys.
- He collected the same number of _____ and _____ . (Eg 1, 2)
- He collected _____ items altogether.
Image in this question is not available.
Level 3
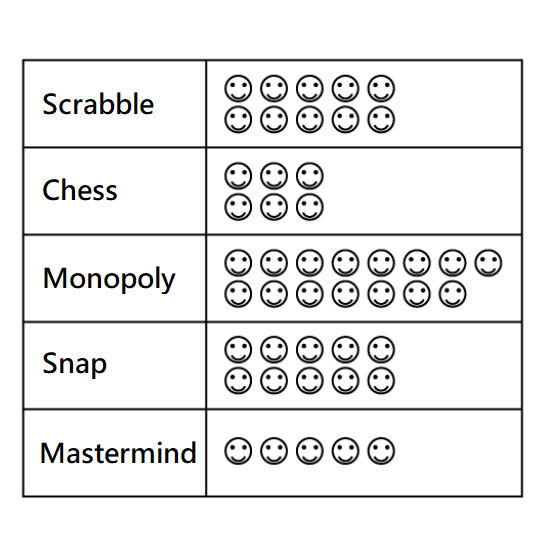
Look at the picture graph.
This graph shows the favourite board games of a group of children. Each smiley stands for 1 child. Give the answers in numbers.
- _____ children like Scrabble.
- 5 more children prefer Snap to _____.
- _____ fewer children prefer chess to Monopoly.
- The same number of children like _____ and _____. (Eg 1, 2)
Level 3
Look at the picture graph.
This graph shows the favourite board games of a group of children. Each smiley stands for 1 child. Give the answers in numbers.
- _____ children like Scrabble.
- 5 more children prefer Snap to _____.
- _____ fewer children prefer chess to Monopoly.
- The same number of children like _____ and _____. (Eg 1, 2)
Image in this question is not available.
Level 1
Jane has 4 different pieces of string measuring 20 cm, 18 cm, 10 cm and 12 cm. What is the average length of each piece of string?
1 m
Image in this question is not available.
Level 1 PSLE
The sum of 4 numbers is 1020. One of the numbers is 180.
What is the average of the other 3 numbers?
1 m
Image in this question is not available.
Level 1
During a donation drive, Lisa and her 4 friends collected a total of $5160 in six weeks. What was the average amount each of them collected in a week?
1 m
Image in this question is not available.
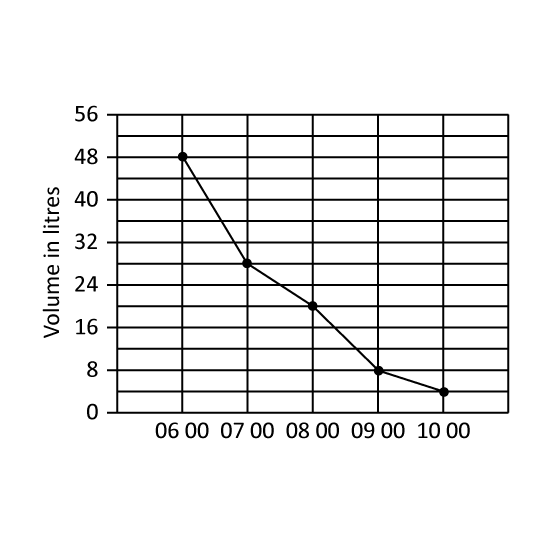
Level 1 PSLE
A tank was filled with 48 litres of water at 06 00. Water flowed out of the tank from 06 00 to 11 00. The line graph shows the amount of water in the tank from 06 00 to 10 00. What was the average decrease in the volume of water in litres per hour from 06 00 to 10 00? (Give your answer in ℓ.)
Image in this question is not available.
Level 1
The total mass of 30 children is 612 kg. What is the average mass of one child? Give the answer in 1 decimal place.
1 m
Image in this question is not available.
Level 1 PSLE
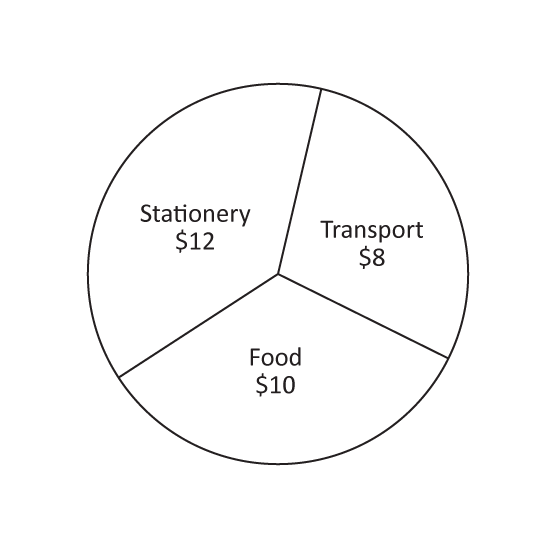
The pie chart shows how John spent the money his mother gave him. What fraction of the money did he spend on food?
Level 1 PSLE
The pie chart shows how John spent the money his mother gave him. What fraction of the money did he spend on food?
Image in this question is not available.
Level 1
The average mass of a tiger and a leopard is 183 kg. The tiger's mass is 7 kg more than the leopard's. Find the mass of the tiger.
1 m
Image in this question is not available.
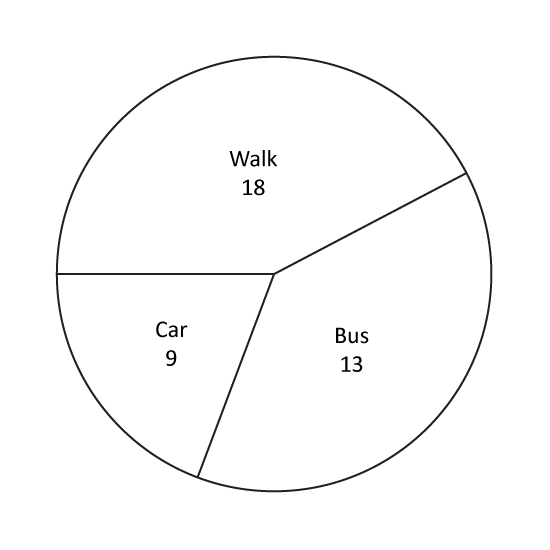
Level 1 PSLE
The pie chart shows how a class of 40 students go to school. What percentage of the class walk to school?
Level 1 PSLE
The pie chart shows how a class of 40 students go to school. What percentage of the class walk to school?
Image in this question is not available.
Level 1
A tiger eats an average of 28 kg of meat per day, while a lion eats an average of 30.5 kg of meat per day. How much more meat than the tiger will the lion eat in a week?
1 m
Image in this question is not available.
Level 1 PSLE
A group of 200 pupils was asked to name their favourite sports. The pie chart shows their choices and the number of pupils who chose each of the sports. Which sports was chosen by 25% of the pupils? Give the answer in letter.
Level 1 PSLE
A group of 200 pupils was asked to name their favourite sports. The pie chart shows their choices and the number of pupils who chose each of the sports. Which sports was chosen by 25% of the pupils? Give the answer in letter.
Image in this question is not available.
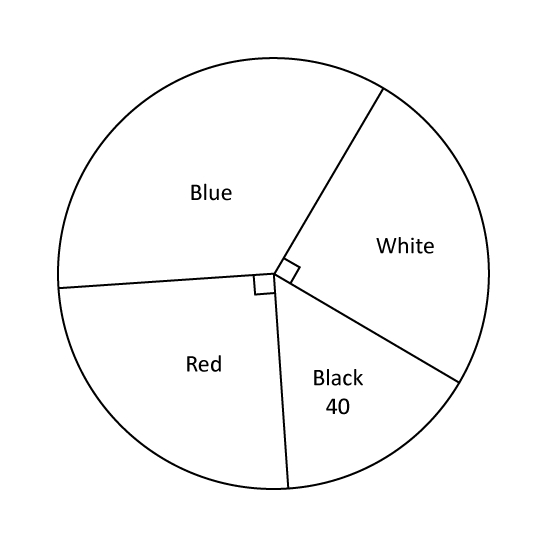
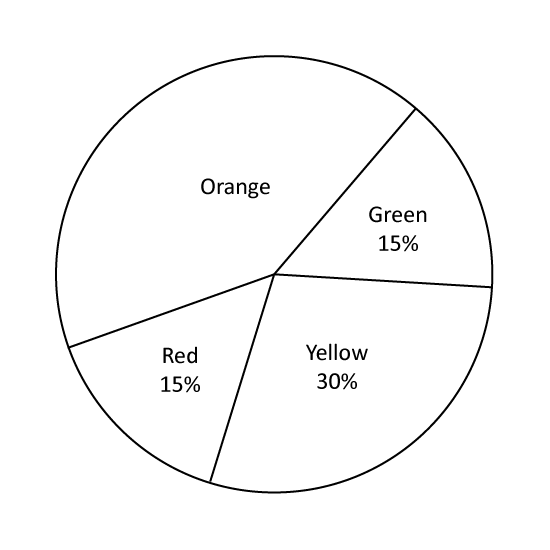
Level 1 PSLE
The pie chart shows the favourite colours of a group of pupils. What percentage of the pupils choose orange as their favourite colour?
Level 1 PSLE
The pie chart shows the favourite colours of a group of pupils. What percentage of the pupils choose orange as their favourite colour?
Image in this question is not available.