Level 1 PSLE
Look at the graph and answer the following questions.
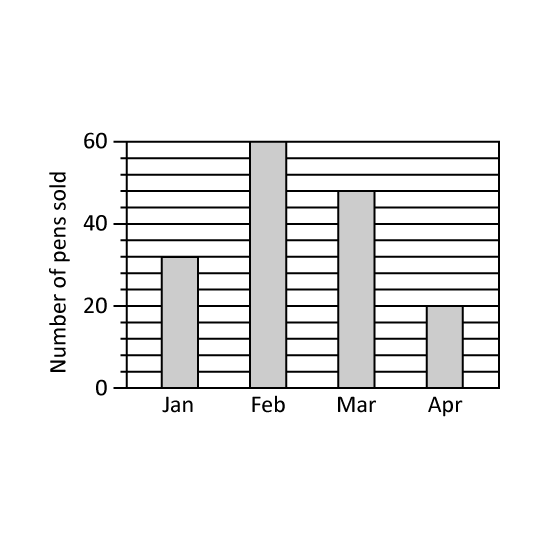
- How many pens did the shop sell in March?
- The number of pens sold in May was an 60% increase from the number sold in April. How many pens were sold in May?
Level 1 PSLE
Look at the graph and answer the following questions.
- How many pens did the shop sell in March?
- The number of pens sold in May was an 60% increase from the number sold in April. How many pens were sold in May?
Image in this question is not available.
Level 2 PSLE
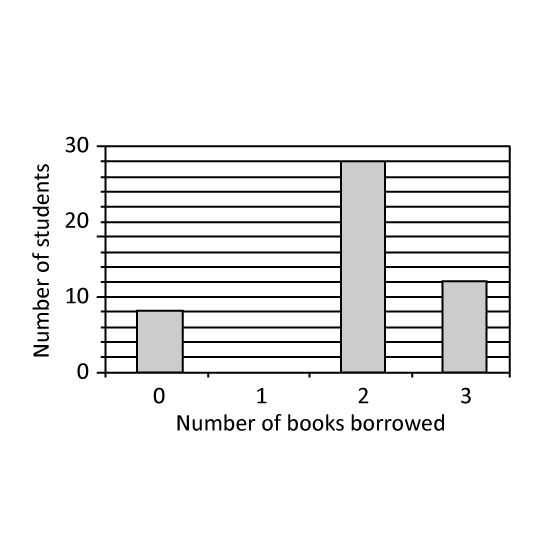
The bar graph shows the number of books borrowed by students in the school library. 14 of the students borrowed 1 book each. How many students borrowed 1 book each?
Level 2 PSLE
The bar graph shows the number of books borrowed by students in the school library. 14 of the students borrowed 1 book each. How many students borrowed 1 book each?
Image in this question is not available.
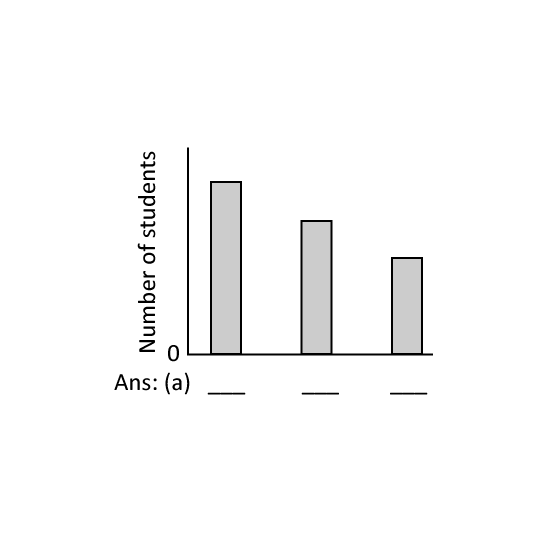
Level 2 PSLE Students played only one sport - basketball, football or volleyball.
13 of them played football. The number who played volleyball was
12 of the number who played basketball.
- Identify the sports of each bar. Give your answers in letters in the following sequence: Bar 1, Bar 2, Bar 3 by using the first letter of the sport. (Eg B, V, F for Basketball, Volleyball, Football)
- What fraction of the students played basketball?
Image in this question is not available.
Level 2 PSLE
School camp T-shirts were available in 4 colours: black, blue, red and white. At the camp, each child chose one T-shirt. The pie chart represents the children's choice of T-shirt colours. 40 children chose black T-shirts. The children's choice of T-shirt colours is also represented by the bar graph. The bar that shows the number of children who chose blue T-shirts has not been drawn. How many children chose blueT-shirts?
Image in this question is not available.
Level 2 PSLE
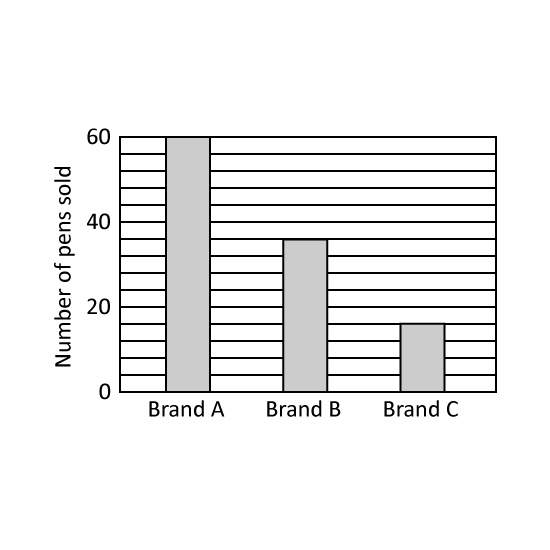
A shop sold three brands of pens: Brand A, Brand B and Brand C. The bar graph shows the number of pens sold for each brand in one day.
- How many pens were sold altogether?
- The shop collected $270 from selling the pens. The prices of Brand A, Brand B, and Brand C pens were in the ratio 1 : 2 : 3. How much money was collected from selling Brand B pens?
Level 2 PSLE
A shop sold three brands of pens: Brand A, Brand B and Brand C. The bar graph shows the number of pens sold for each brand in one day.
- How many pens were sold altogether?
- The shop collected $270 from selling the pens. The prices of Brand A, Brand B, and Brand C pens were in the ratio 1 : 2 : 3. How much money was collected from selling Brand B pens?
Image in this question is not available.
Level 2 PSLE
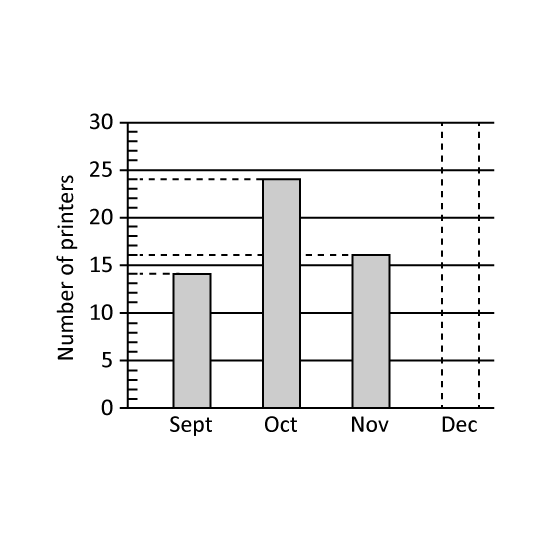
The bar graph shows the number of printers sold by Mr. Owen in 4 months. The bar that shows the number of printers sold in December has not been drawn. The number of printers sold in October was 30% of the total number of printers sold in the 4 months.
- What was the total number of printers sold in the 4 months?
- What was the number of printers sold in December?
Level 2 PSLE
The bar graph shows the number of printers sold by Mr. Owen in 4 months. The bar that shows the number of printers sold in December has not been drawn. The number of printers sold in October was 30% of the total number of printers sold in the 4 months.
- What was the total number of printers sold in the 4 months?
- What was the number of printers sold in December?
Image in this question is not available.
Level 2 PSLE
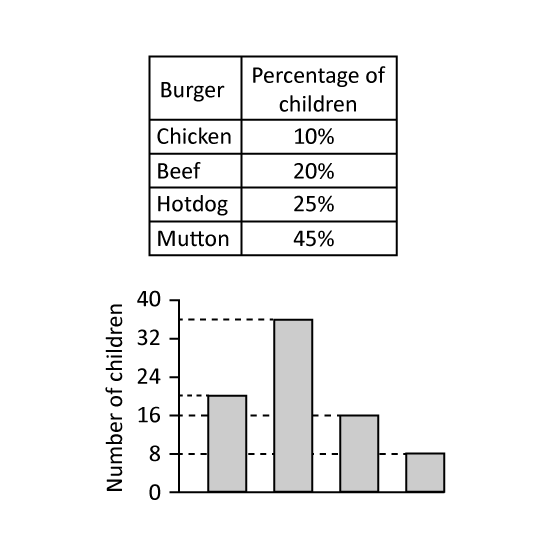
A group of children was asked to choose one burger from chicken, beef, hotdog and mutton. The table represents the children's choices. The children's choices were also represented by a bar graph but the names of the burger were not shown. What was the total number of children who chose chicken and hotdog burgers?
Level 2 PSLE
A group of children was asked to choose one burger from chicken, beef, hotdog and mutton. The table represents the children's choices. The children's choices were also represented by a bar graph but the names of the burger were not shown. What was the total number of children who chose chicken and hotdog burgers?
Image in this question is not available.
Level 2 PSLE
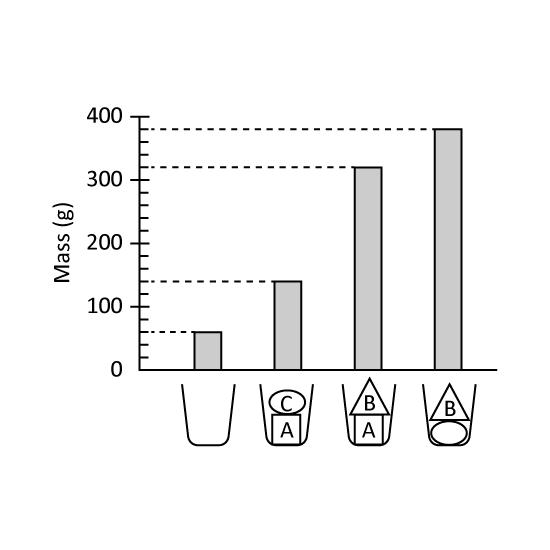
The graph shows the mass of a cup when empty and when different combinations of objects A, Band C are placed in the cup.
- What is the mass of the empty cup?
- What is the average mass of the objects A, Band C?
Level 2 PSLE
The graph shows the mass of a cup when empty and when different combinations of objects A, Band C are placed in the cup.
- What is the mass of the empty cup?
- What is the average mass of the objects A, Band C?
Image in this question is not available.
Level 2 PSLE
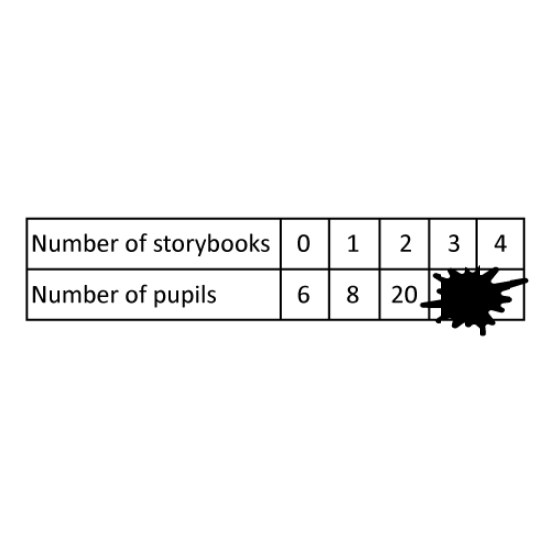
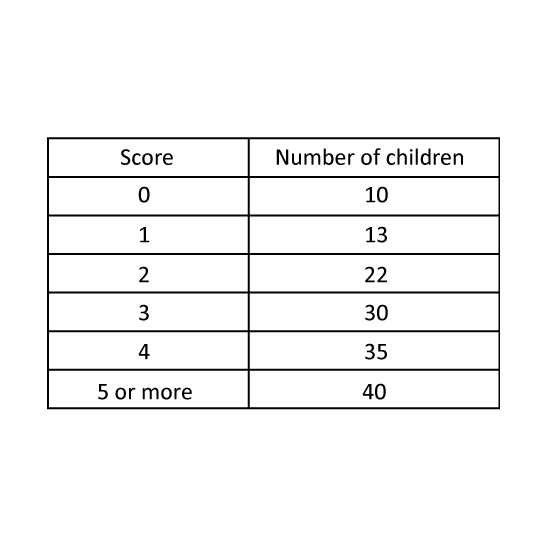
The table shows the number of storybooks read by each pupil in a group. Part of the table is covered by an ink blot. There were 43 pupils who read at least 2 storybooks.
- How many pupils who read more than 2 storybooks?
- How many pupils are in the group?
Level 2 PSLE
The table shows the number of storybooks read by each pupil in a group. Part of the table is covered by an ink blot. There were 43 pupils who read at least 2 storybooks.
- How many pupils who read more than 2 storybooks?
- How many pupils are in the group?
Image in this question is not available.
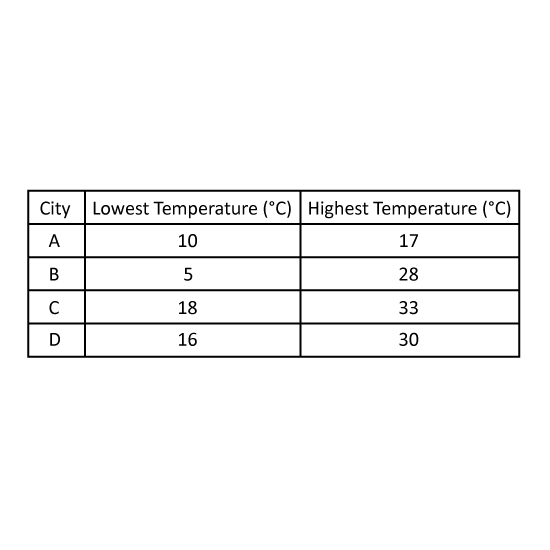
Level 1 PSLE The table shows the temperatures of cities A, B, C and D.
- When Jane was at some of these cities, the temperature was 15°C. Name the cities. Give your answer in letters. (Eg A, B)
- Name the city with the smallest difference in temperatures. Find this difference. Give your answer in this format. (Eg B, 7°C)
Image in this question is not available.
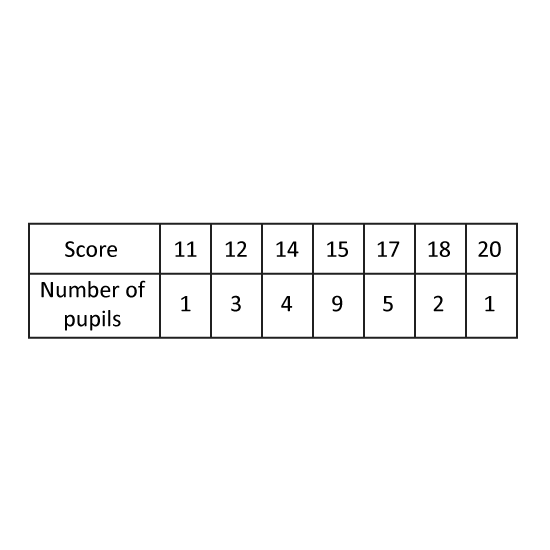
Level 2 PSLE
The table shows the number of pupils with the following scores. A higher score means a better performance. Prizes were given to the top 8 pupils. Aaron won a prize. What was the lowest he could have scored?
Level 2 PSLE
The table shows the number of pupils with the following scores. A higher score means a better performance. Prizes were given to the top 8 pupils. Aaron won a prize. What was the lowest he could have scored?
Image in this question is not available.
Level 2 PSLE
Participants of a quiz must obtain at least a certain score in the first round to qualify for the next round. There were 150 participants in the first round and the table shows the number of participants for each score. 50% of the participants did not qualify for the next round. From the table, what was the lowest score of a participant who qualified for the next round?
Image in this question is not available.
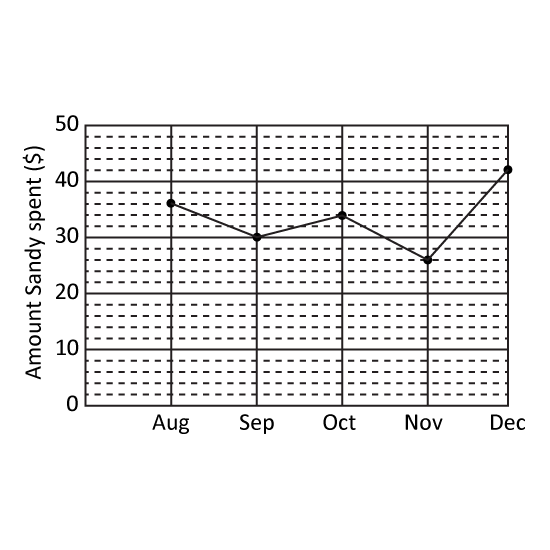
Level 1 PSLE
Sandy received $70 from his father each month for her allowance. The line graph shows the amount of allowance she spent each month.
-
What is the difference between the amounts Sandy spent in October and in December?
-
Write down all the months in which Sandy spent more than half her allowance. Give the answer in short form. (Eg Jan, Mar)
Image in this question is not available.
Level 1 PSLE
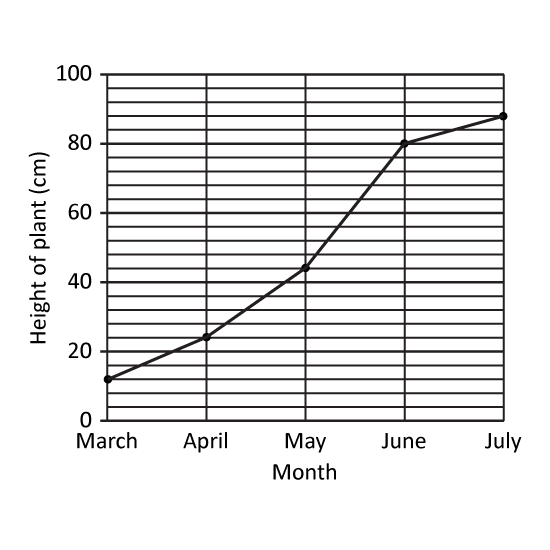
The graph shows the height of a plant from January to May.
- What was the height of the plant in March?
- During which period did the plant grow the most? Give your answer in numbers. (Eg Jan to Feb = 1 to 2)
Level 1 PSLE
The graph shows the height of a plant from January to May.
- What was the height of the plant in March?
- During which period did the plant grow the most? Give your answer in numbers. (Eg Jan to Feb = 1 to 2)
Image in this question is not available.
Level 1 PSLE
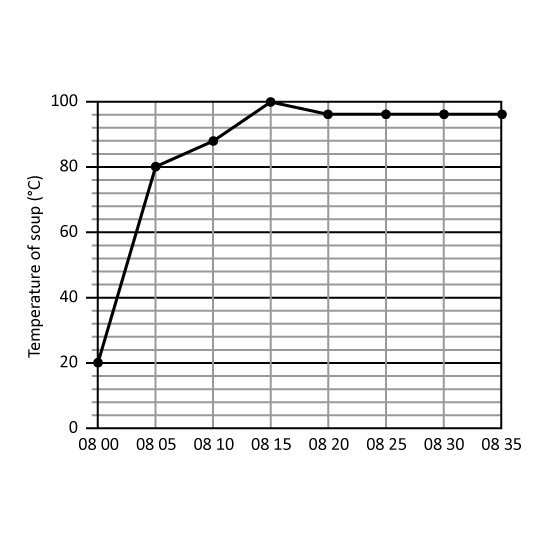
The line graph shows the temperature of soup in a pot from 08 00 to 08 35. (Give your answers in °C.)
- What was the temperature of the soup at 08 25?
- What was the increase in temperature per minute over the first 5 minutes?
Level 1 PSLE
The line graph shows the temperature of soup in a pot from 08 00 to 08 35. (Give your answers in °C.)
- What was the temperature of the soup at 08 25?
- What was the increase in temperature per minute over the first 5 minutes?
Image in this question is not available.
Level 2 PSLE
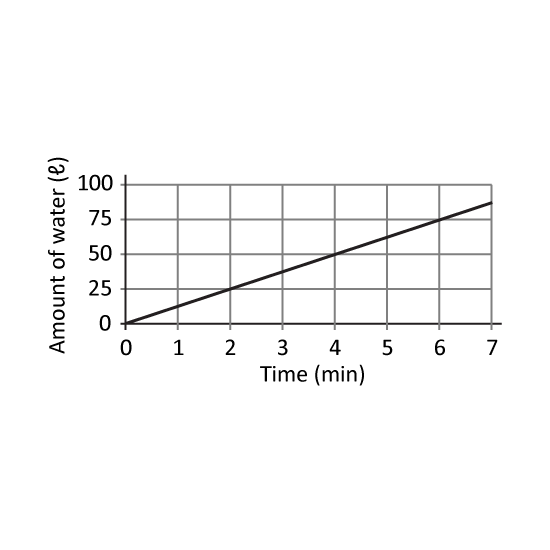
The graph shows the amount of water that flows from a tap. At this rate, how many litres will flow from the tap in 28 minutes?
Level 2 PSLE
The graph shows the amount of water that flows from a tap. At this rate, how many litres will flow from the tap in 28 minutes?
Image in this question is not available.
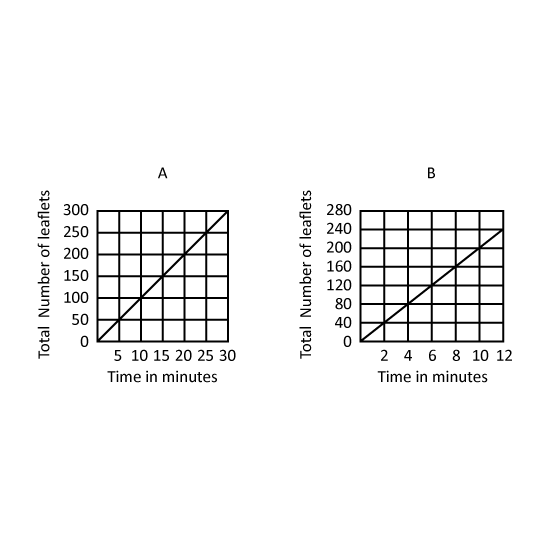
Level 3 PSLE The graphs show the total number of leaflets machines A and B printed from the start. Both machines started printing at the same time.
- How many more leaflets did B print than A in 5 minutes?
- Both machines did not change their rates of printing throughout. When A had printed 200 leaflets, how many leaflets had B printed?
Image in this question is not available.
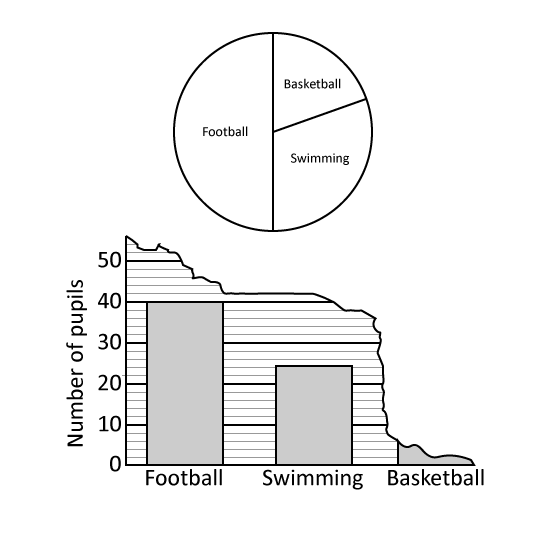
Level 2 PSLE
A group of boys were asked to choose their favourite sport from swimming, basketball and football. The pie chart represents the boys choices. Half of the group chose football.
- What percentage of the group chose swimming?
- The boys' choices were also represented by a bar graph. Part of the graph had been torn off. How many boys chose basketball?
Image in this question is not available.
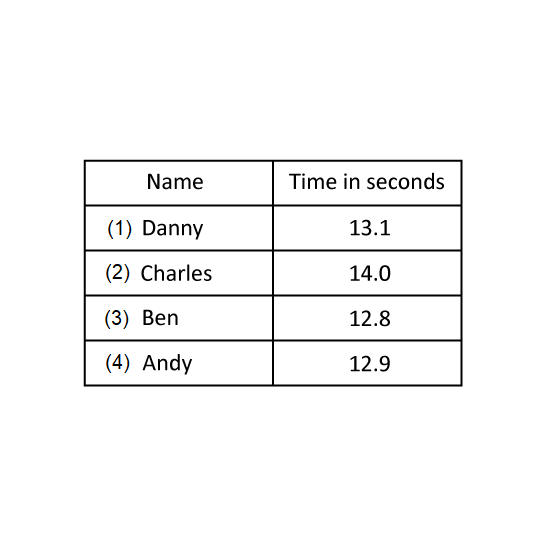
Level 1 PSLE
The table shows the times taken by four boys to complete a race.
- Who was the second in the race? Give your answer in number. (Eg 1)
- What was the average time taken by the 4 boys to complete the race?
Level 1 PSLE
The table shows the times taken by four boys to complete a race.
- Who was the second in the race? Give your answer in number. (Eg 1)
- What was the average time taken by the 4 boys to complete the race?
Image in this question is not available.
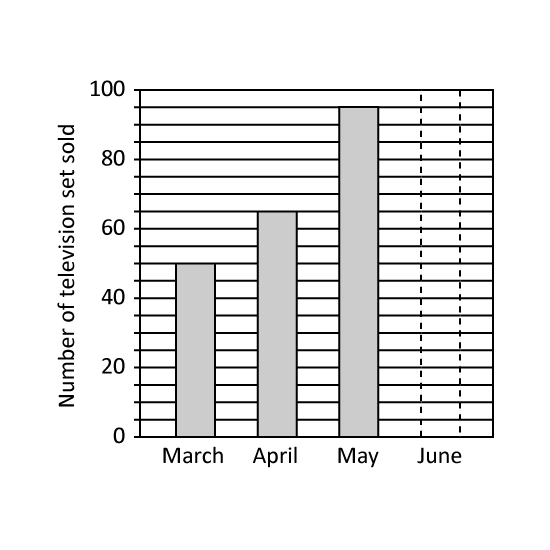
Level 2 PSLE
The graph shows the number of television sets sold from March to June. The number of television sets sold in June is equal to the average number of television sets sold from March to May. Find the number of television sets sold in June.
Level 2 PSLE
The graph shows the number of television sets sold from March to June. The number of television sets sold in June is equal to the average number of television sets sold from March to May. Find the number of television sets sold in June.
Image in this question is not available.