Level 3
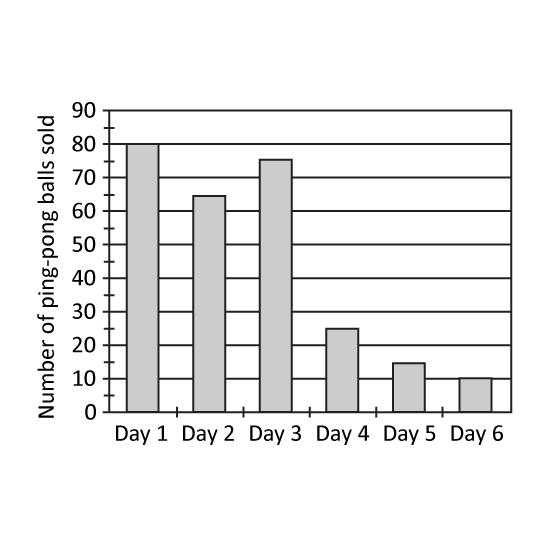
A sports shop had 300 ping-pong balls for sale. Each ping-pong ball is sold at $2. At the end of each day, the number of ping-pong balls was recorded in the bar graph shown.
What fraction of the total number of ping-pong balls was left at the end of Day 3? Express your answer in its simplest form.
If the shop decided to sell every 5 ping-pong balls at $9.30 from Day 4 onwards, how much less would it collect from the sale of the ping-pong balls?
Level 3
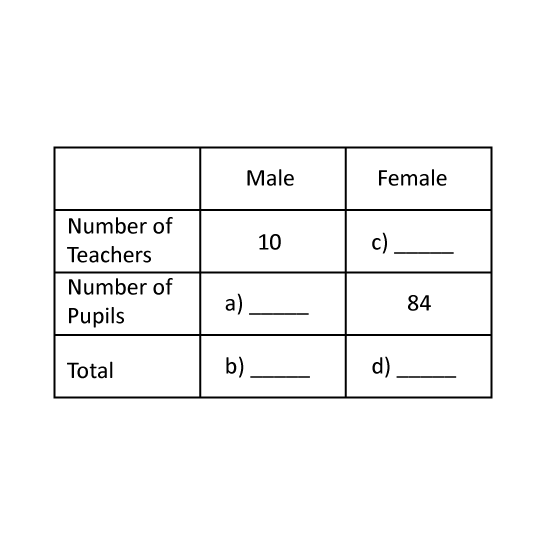
The table shows the number of teachers and pupils who went to Snow City. A total of 220 teachers and pupils went to Snow City. 198 of them are pupils. Complete the table.
Level 3
The table shows the number of teachers and pupils who went to Snow City. A total of 220 teachers and pupils went to Snow City. 198 of them are pupils. Complete the table.
Level 3
The line graph shows the number of boys and girls in each sports school.
How many pupils were there in Sports School B?
How many more girls than boys were there in Sports School C?
At the end of the year, an equal number of boys and girls from Sports School D were transferred to Sports School A. The fraction of the number of boys to girls in Sports School A becomes 23. Find the total number of boys and girls that were transferred from Sports School D to Sports School A.
Level 3
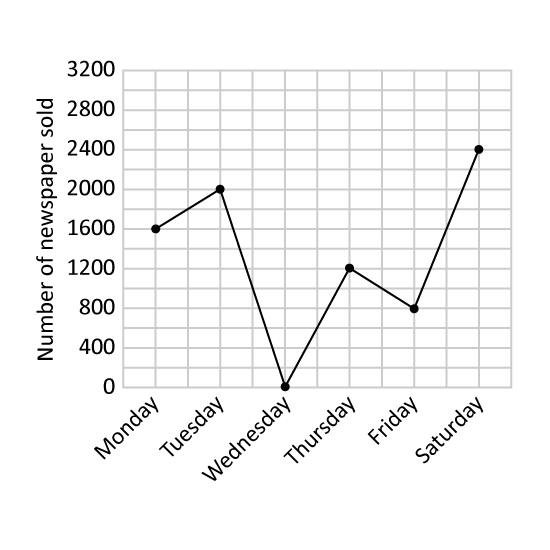
The line graph shows the total number of cars sold by a car dealer in the first six months of the year.
In which two months were there a consecutive increase in the number of cars sold? Give the answer in short form. (Eg Jan, Feb)
What fraction of the cars was sold in the month of the lowest sale?
The car dealer was paid a fixed amount of money for every car he sold. He received $3200 more in April than in February. How much money did he receive from selling a car?