Level 2 PSLE
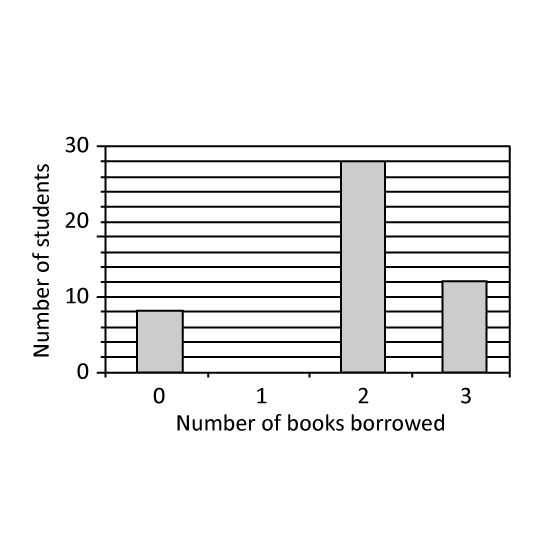
The bar graph shows the number of books borrowed by students in the school library. 14 of the students borrowed 1 book each. How many students borrowed 1 book each?
Level 2 PSLE
The bar graph shows the number of books borrowed by students in the school library. 14 of the students borrowed 1 book each. How many students borrowed 1 book each?
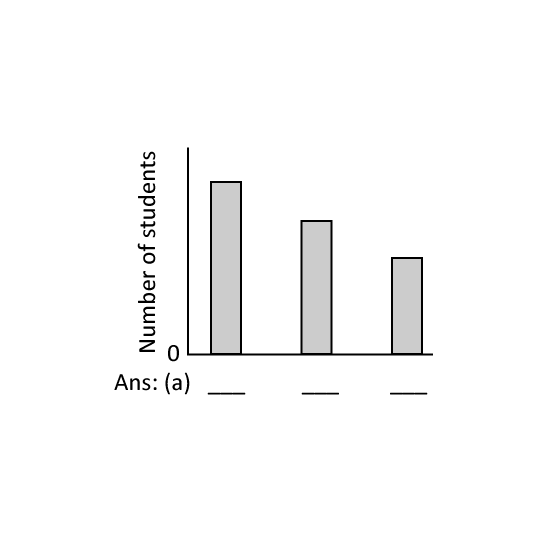
Level 2 PSLE Students played only one sport - basketball, football or volleyball. 13 of them played football. The number who played volleyball was 12 of the number who played basketball.
Identify the sports of each bar. Give your answers in letters in the following sequence: Bar 1, Bar 2, Bar 3 by using the first letter of the sport. (Eg B, V, F for Basketball, Volleyball, Football)
What fraction of the students played basketball?
Level 2 PSLE Students played only one sport - basketball, football or volleyball. 13 of them played football. The number who played volleyball was 12 of the number who played basketball.
Identify the sports of each bar. Give your answers in letters in the following sequence: Bar 1, Bar 2, Bar 3 by using the first letter of the sport. (Eg B, V, F for Basketball, Volleyball, Football)
Level 2 PSLE
School camp T-shirts were available in 4 colours: black, blue, red and white. At the camp, each child chose one T-shirt. The pie chart represents the children's choice of T-shirt colours. 40 children chose black T-shirts. The children's choice of T-shirt colours is also represented by the bar graph. The bar that shows the number of children who chose blue T-shirts has not been drawn. How many children chose blueT-shirts?
Level 2 PSLE
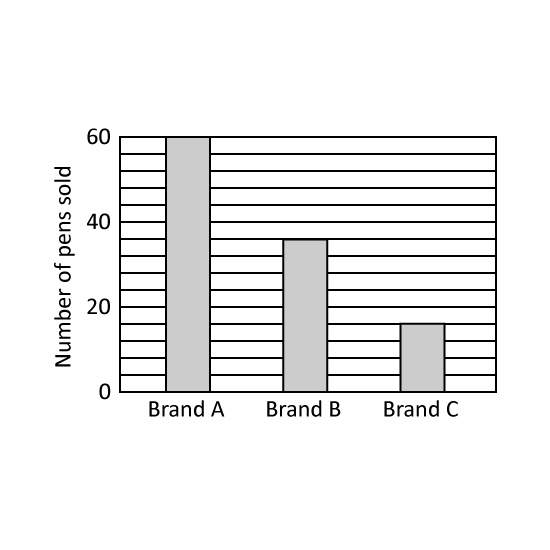
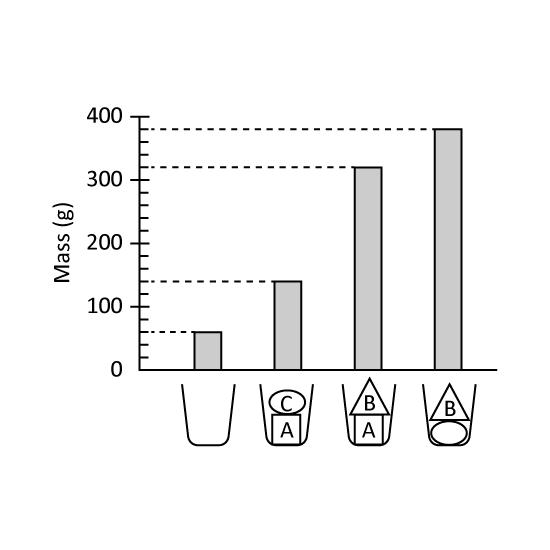
A shop sold three brands of pens: Brand A, Brand B and Brand C. The bar graph shows the number of pens sold for each brand in one day.
How many pens were sold altogether?
The shop collected $270 from selling the pens. The prices of Brand A, Brand B, and Brand C pens were in the ratio 1 : 2 : 3. How much money was collected from selling Brand B pens?
Level 2 PSLE
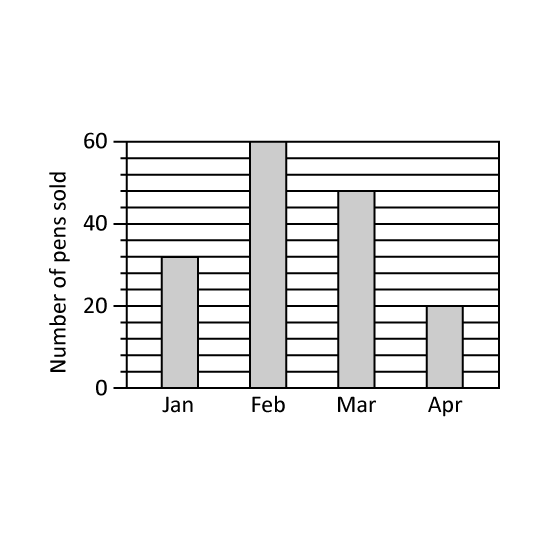
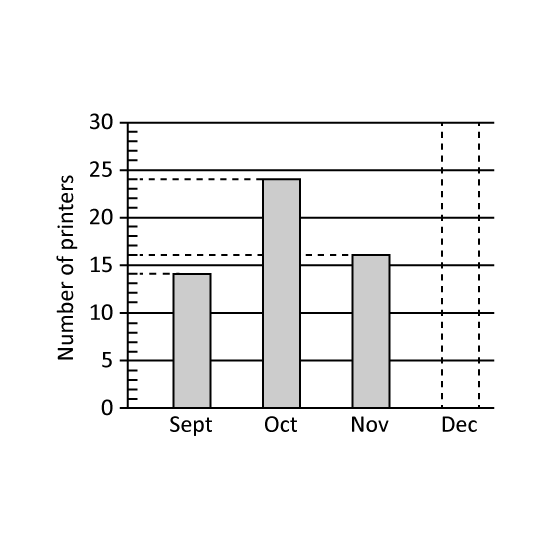
The bar graph shows the number of printers sold by Mr. Owen in 4 months. The bar that shows the number of printers sold in December has not been drawn. The number of printers sold in October was 30% of the total number of printers sold in the 4 months.
What was the total number of printers sold in the 4 months?
What was the number of printers sold in December?
Level 2 PSLE
The bar graph shows the number of printers sold by Mr. Owen in 4 months. The bar that shows the number of printers sold in December has not been drawn. The number of printers sold in October was 30% of the total number of printers sold in the 4 months.
What was the total number of printers sold in the 4 months?
Level 2 PSLE
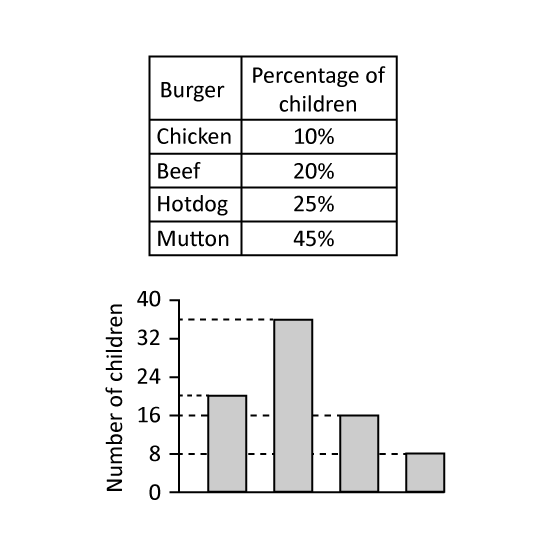
A group of children was asked to choose one burger from chicken, beef, hotdog and mutton. The table represents the children's choices. The children's choices were also represented by a bar graph but the names of the burger were not shown. What was the total number of children who chose chicken and hotdog burgers?
Level 2 PSLE
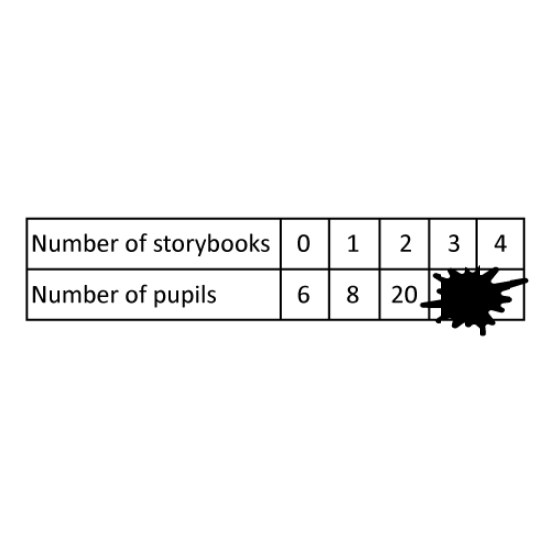
The table shows the number of storybooks read by each pupil in a group. Part of the table is covered by an ink blot. There were 43 pupils who read at least 2 storybooks.
How many pupils who read more than 2 storybooks?
How many pupils are in the group?
Level 2 PSLE
The table shows the number of storybooks read by each pupil in a group. Part of the table is covered by an ink blot. There were 43 pupils who read at least 2 storybooks.