Level 2
The graph shows the favourite color of girls in a class. Study the graph and answer the following.
  1. If 4 girls like red, how many girls does each (/) stand?
  2. How many girls are there altogether in the class?
2 m
Level 1
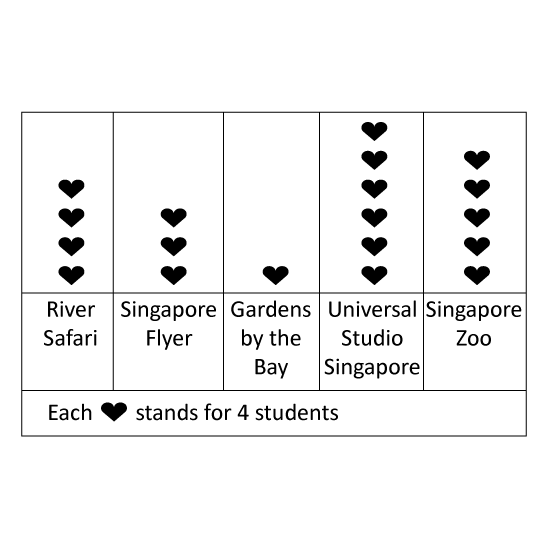
The picture graph shows the favourite tourist attraction of a group of students. How many students chose Universal Studio Singapore as their favourite tourist attraction?
2 m
Level 2
The picture graph shows the number of points each adult scored during a volleyball match.
  1. Which two adults scored the same numbers of points? Give the answer in numbers. (Eg 1, 2)
  2. How many more points did John score than Paul?
2 m
Level 1
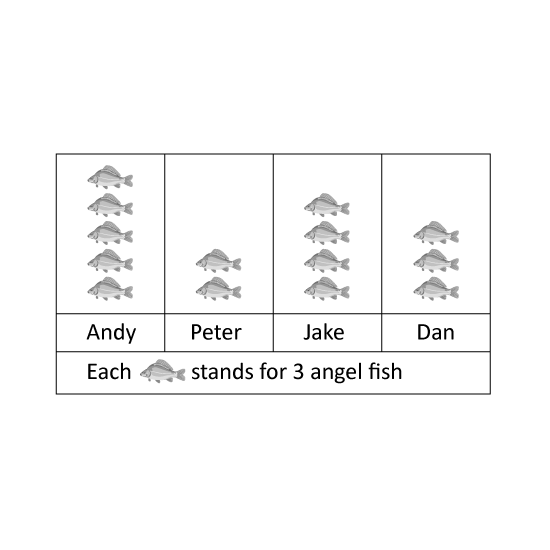
Study the graph carefully.
The graph shows the number of angel fish 4 boys keep as pets. How many more angel fish must Peter buy so that he has as many angel fish as Jake?
2 m
Level 2
The graph shows the different CCAs a class of pupils participate in.
  1.           pupils join IT Club as a CCA.
  2. There is an equal number of pupils participating in                    and                   .
  3.           more pupils join IT Club than Scouts.
4 m
Level 2
The table shows the number of bulbs bought by 3 classes for a party.
  1. How many bulbs should be drawn for class 2C?
  2. How many bulb should be drawn for class 2B?
  3. Altogether, how many bulbs are there?
5 m
Level 2
The graph shows the favourite flowers of the group of students.
  1. How many students like Rose and Orchid?
  2. How many more students like Tulip than Lily?
  3. How many number of flowers will be added to tulips to have the same number with roses?
5 m
Level 2
The graph shows the different colors of flowers in the garden.
  1. How many red and pink flowers are there in the garden?
  2. How many more pink flowers than violet flowers?
  3. There are 10 fewer violet flowers than                    flowers. Give your answer in number. (Eg 1)
5 m
Level 3
The graph shows the number of fruits sold in a market.
  1. How many more durians are there than kiwis?
  2. If each fruit was sold at $10, how much money was collected from selling the kiwi and the banana?
5 m
Level 3
The graph shows the amount of money saved by 3 boys in a week. Answer the following.
  1. How much more money did Alex save than Ben?
  2. After Jay had spent $5 on a pen. He divided the rest of her savings equally among the other 3 boys. How much money did each boy receive from Jay?
5 m
Level 3
The graph shows the number of stickers collected by 4 students.
  1. How many stickers did Ann collect?
  2. Who collected fewer stickers than Ann? Give your answer in number. (Eg 1)
  3. How many students collected more than 10 stickers?
  4. How many more stickers did Bill collect than Jen?
5 m
Level 3
The graph shows the different flavors of ice cream the adults like.
  1. How many adults like mango flavor?
  2. How many adults like Ube flavor?
  3. How many adults like vanilla and choco flavor?
  4. How many more adults like mango flavor than vanilla flavor?
  5. How many adults are there in the group altogether?
5 m
Level 3
The graph shows the number of stamps 3 girls collected. Study the graph and answer the following.
  1. Who collected 10 stamps? Give the answer in number. (Eg 1)
  2. Which 2 girls collected a total of 26 stamps? Give the answer in numbers. (Eg 1, 2)
  3. How many stamps must Ann give to Jen so that both of them would have the same number of stamps?
5 m