Level 1
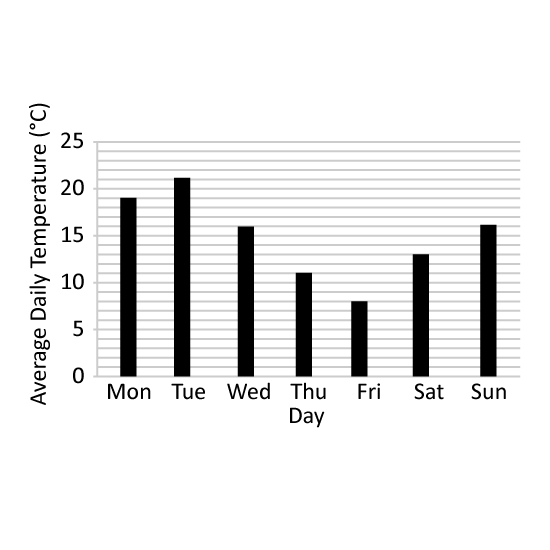
The bar graph shows the average daily temperature experienced by Country A in a week. What was the difference in the highest and lowest average daily temperatures in that week?
Level 1
The bar graph shows the average daily temperature experienced by Country A in a week. What was the difference in the highest and lowest average daily temperatures in that week?
Level 3
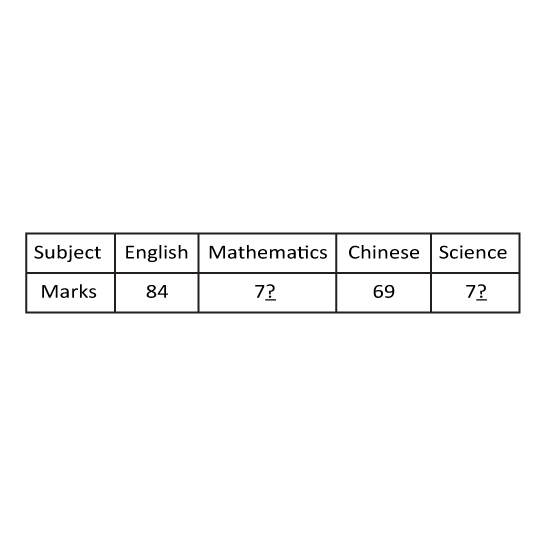
The table shows the marks Michelle scored in her end of year examinations. Michelle scored an average of 75 marks for the 4 subjects. What is the greatest possible mark that she could have scored for Science?
Level 3
The table shows the marks Michelle scored in her end of year examinations. Michelle scored an average of 75 marks for the 4 subjects. What is the greatest possible mark that she could have scored for Science?