Level 2
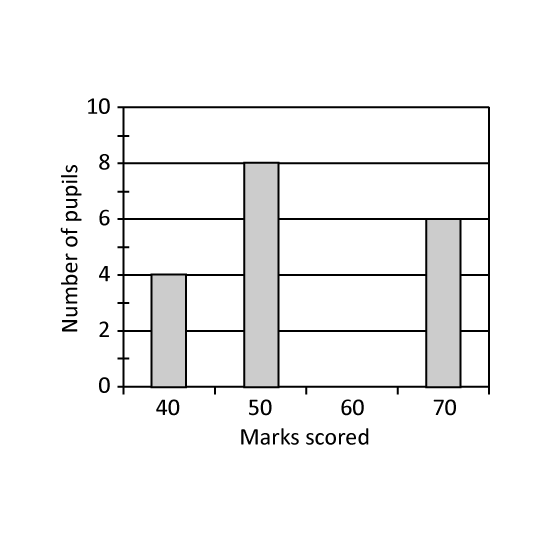
The bar graph shows the exam results of a group of pupils. How many pupils who scored 60 marks, given that 12 of the pupils scored 50 marks and below.
Level 2
The bar graph shows the exam results of a group of pupils. How many pupils who scored 60 marks, given that 12 of the pupils scored 50 marks and below.
Level 2
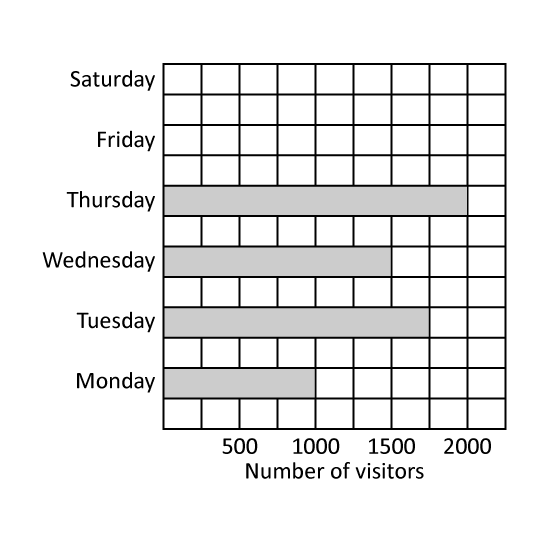
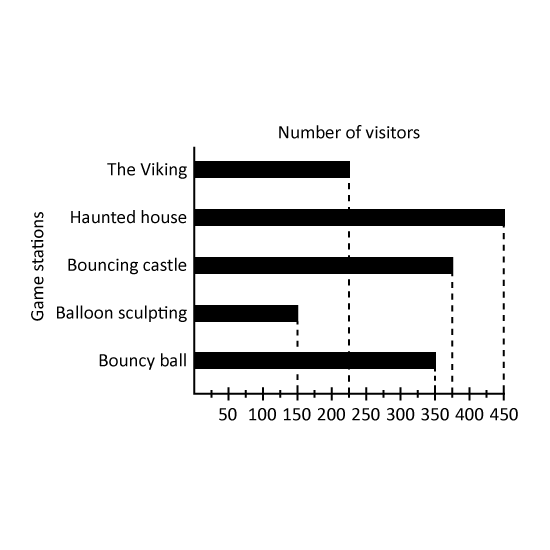
The graph shows the number of visitors to the amusement park. 2 times as many visitors visited the amusement park on Friday as on Monday. How many visitors visited the amusement park on Friday?
Level 2
The graph shows the number of visitors to the amusement park. 2 times as many visitors visited the amusement park on Friday as on Monday. How many visitors visited the amusement park on Friday?
Level 2
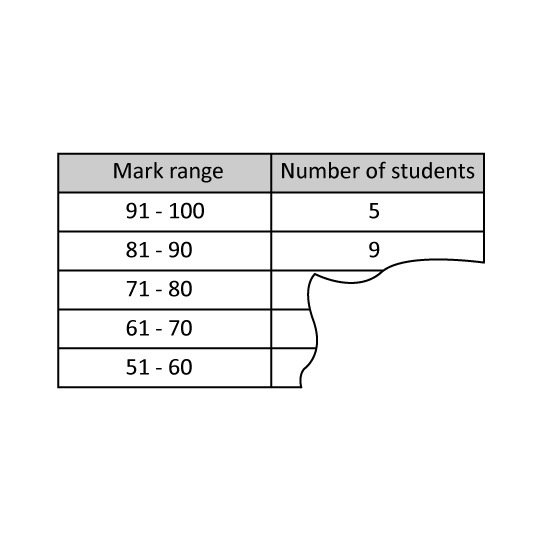
Part of the table was accidentally torn off. The table shows the number of students from class 4C scoring within various mark ranges in a Mathematics test. 35 students scored above 70 marks. How many students scored in the mark range 71 - 80?
Level 2
Part of the table was accidentally torn off. The table shows the number of students from class 4C scoring within various mark ranges in a Mathematics test. 35 students scored above 70 marks. How many students scored in the mark range 71 - 80?