Level 2
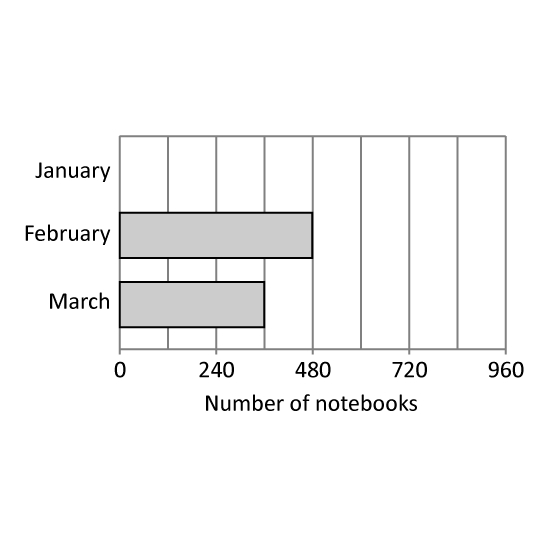
The bar graph shows the number of notebooks sold in 3 months. The bar that shows the number of notebooks in January is not drawn. 38 of the total number of notebooks sold in the 3 months were sold in January. How many notebooks were sold in January?
Level 2
The bar graph shows the number of notebooks sold in 3 months. The bar that shows the number of notebooks in January is not drawn. 38 of the total number of notebooks sold in the 3 months were sold in January. How many notebooks were sold in January?
Level 1 PSLE
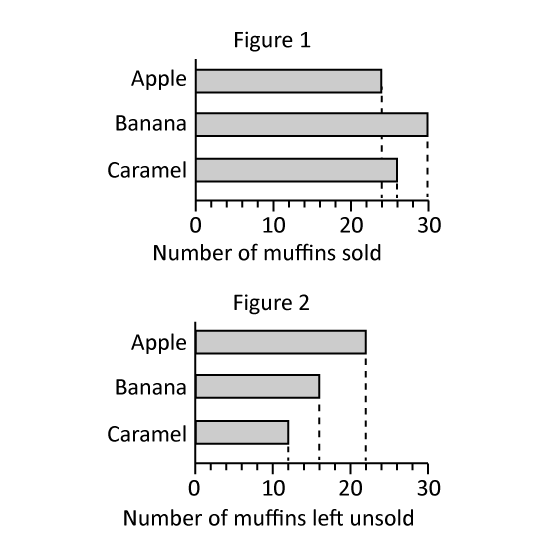
Jen baked some muffins to sell at a funfair. Figure 1 shows the number of muffins that was sold. Figure 2 shows the number of muffins left unsold at the end of the funfair.
What was the number of caramel muffins Jen baked?
Altogether, how many apples and banana muffins were left unsold after the funfair?
Level 1 PSLE
Jen baked some muffins to sell at a funfair. Figure 1 shows the number of muffins that was sold. Figure 2 shows the number of muffins left unsold at the end of the funfair.
What was the number of caramel muffins Jen baked?
Altogether, how many apples and banana muffins were left unsold after the funfair?
Level 2
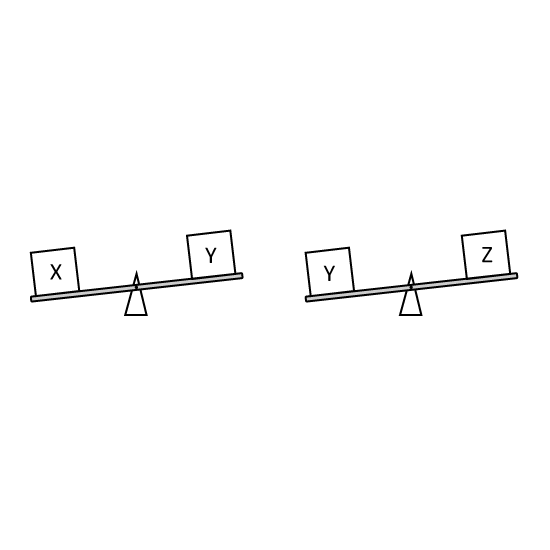
Robert was comparing the mass of 3 boxes as shown . If you will make a line graph for this, which box is at the highest point? Express your answer as the letter of the correct box.
Level 2
Robert was comparing the mass of 3 boxes as shown . If you will make a line graph for this, which box is at the highest point? Express your answer as the letter of the correct box.
Level 2
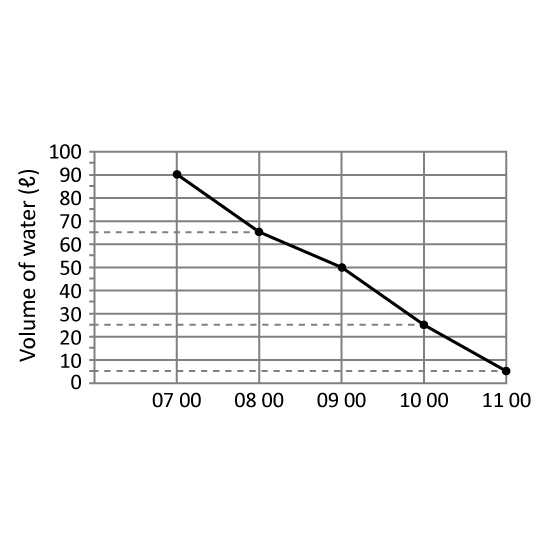
A tank was filled with 90 ℓ of water at 07 00. Water flowed out of the tank from 07 00 to 11 00. The line graph shows the amount of water in the tank from 07 00 to 11 00. Which one-hour period shows the least decrease in the amount of water in the tank? Give your answer in this format. (Eg 12 00 to 13 00)
Level 2
A tank was filled with 90 ℓ of water at 07 00. Water flowed out of the tank from 07 00 to 11 00. The line graph shows the amount of water in the tank from 07 00 to 11 00. Which one-hour period shows the least decrease in the amount of water in the tank? Give your answer in this format. (Eg 12 00 to 13 00)