Level 1
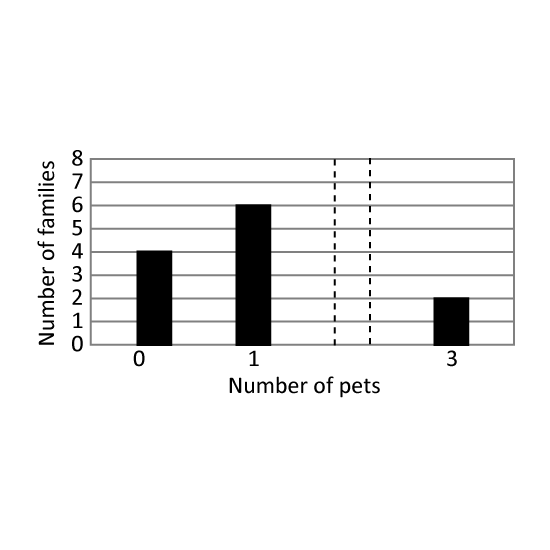
The bar graph shows the number of pets owned by the families living in a block of flats. There are a total of 20 pets in the block. The bar that shows the number of families that has 2 pets is not drawn. How many families have 2 pets?
Level 1
The bar graph shows the number of pets owned by the families living in a block of flats. There are a total of 20 pets in the block. The bar that shows the number of families that has 2 pets is not drawn. How many families have 2 pets?
Level 1
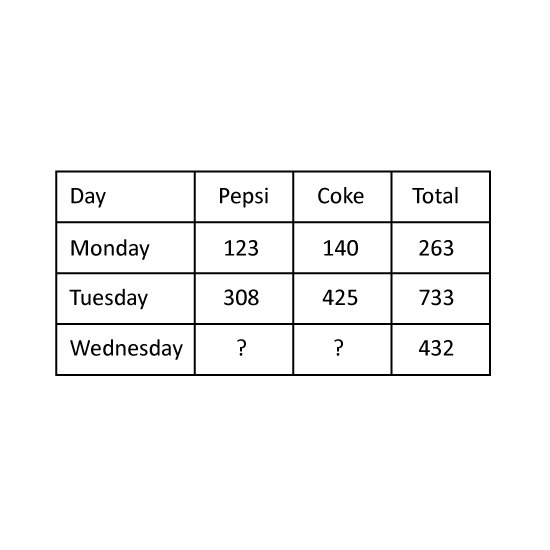
The table shows the number of canned drinks sold during a softball carnival over three days. The number of Coke sold on Wednesday is three times the number of Pepsi, how many cans of Coke were sold on Wednesday?
Level 1
The table shows the number of canned drinks sold during a softball carnival over three days. The number of Coke sold on Wednesday is three times the number of Pepsi, how many cans of Coke were sold on Wednesday?
Level 2
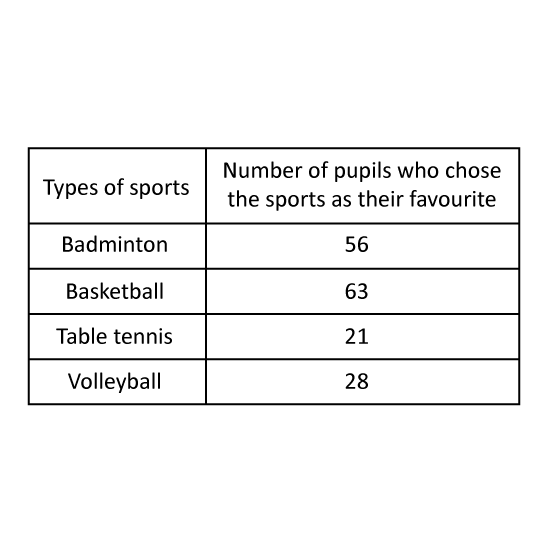
A group of 168 primary four pupils was surveyed to name their favourite sport.
The table shows their choices. 38 of the pupils chose one of the sports as their favourite. Which is the sport? Give your answer in number. (Eg 1)
Level 2
A group of 168 primary four pupils was surveyed to name their favourite sport.
The table shows their choices. 38 of the pupils chose one of the sports as their favourite. Which is the sport? Give your answer in number. (Eg 1)