Level 2
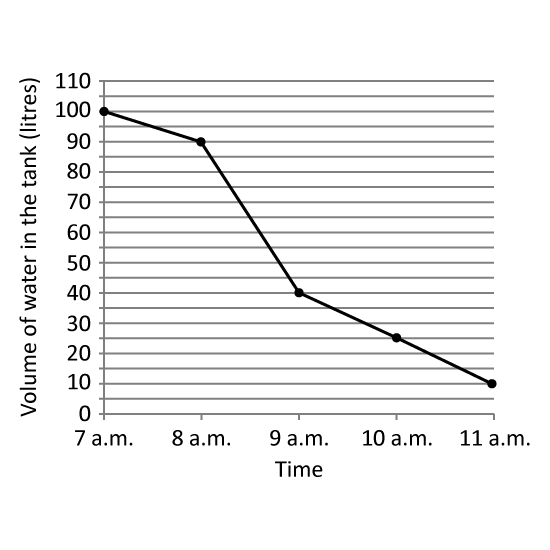
A tank was completely filled with water at 7 a.m Water flowed out of the tank from 7 a.m. to 11 a.m. The line graph shows the volume of water in the tank at each 1-hour interval from 7 a.m. to 11 a.m. At what time was 14 of the tank filled with water?
Level 2
A tank was completely filled with water at 7 a.m Water flowed out of the tank from 7 a.m. to 11 a.m. The line graph shows the volume of water in the tank at each 1-hour interval from 7 a.m. to 11 a.m. At what time was 14 of the tank filled with water?
Level 1 PSLE
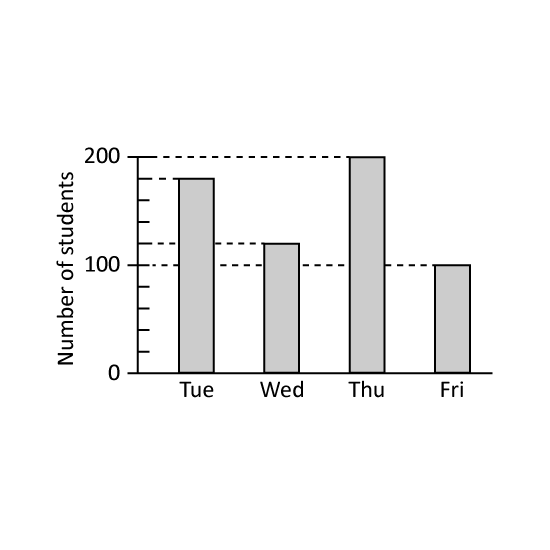
A school conducted checks on its Primary 6 students' eyesight from Tuesday to Friday. Each student had their eyes checked on one of the four days. The bar graph shows the number of students that were checked on each day. What percentage of the Primary 6 students had their eyes checked on Tuesday?
Level 1 PSLE
A school conducted checks on its Primary 6 students' eyesight from Tuesday to Friday. Each student had their eyes checked on one of the four days. The bar graph shows the number of students that were checked on each day. What percentage of the Primary 6 students had their eyes checked on Tuesday?