Level 2
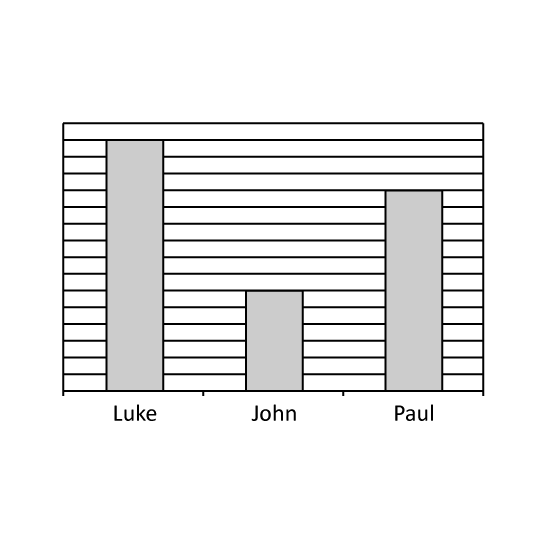
The graph shows the number of marks each child scored for their Math test. How many marks did Paul score if Luke scored 54 marks more than John?
Level 2
The graph shows the number of marks each child scored for their Math test. How many marks did Paul score if Luke scored 54 marks more than John?
Level 2
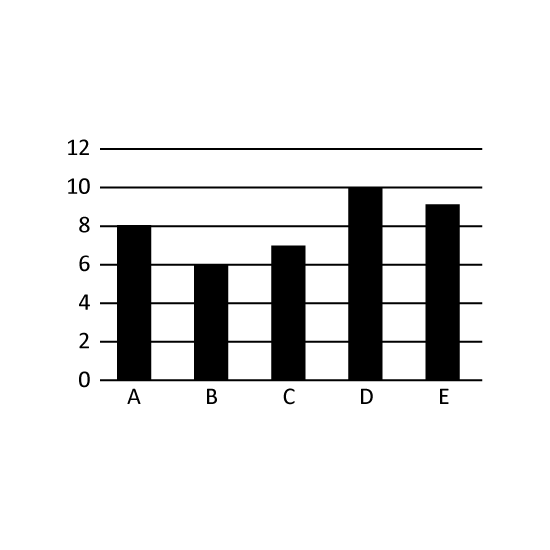
The bar graph shows the number of students in each class. How many more students are in Class D than in Class C? Express it as a percentage of the total number of students in all the classes.
Level 2
The bar graph shows the number of students in each class. How many more students are in Class D than in Class C? Express it as a percentage of the total number of students in all the classes.
Level 2 PSLE
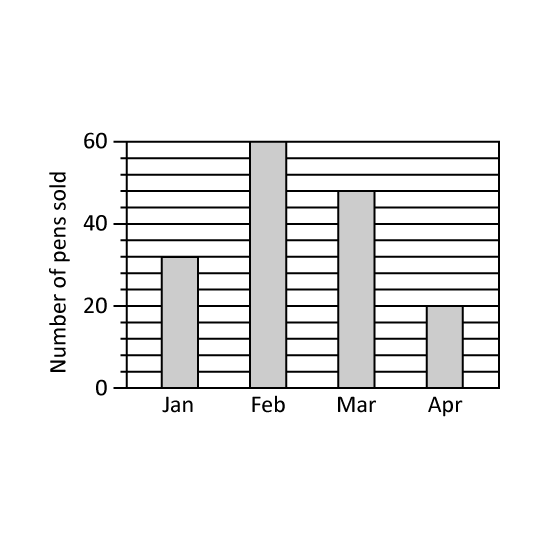
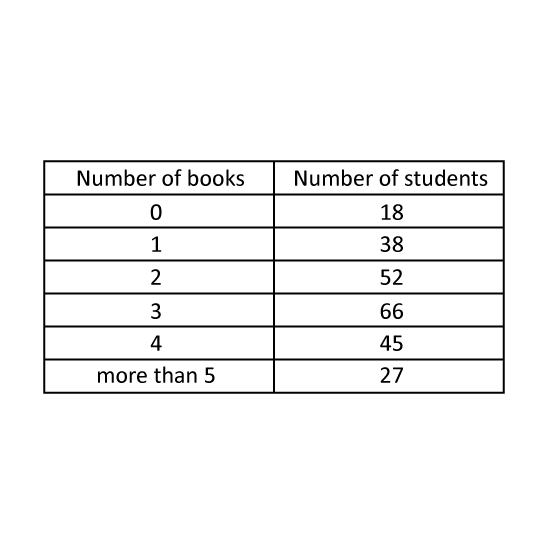
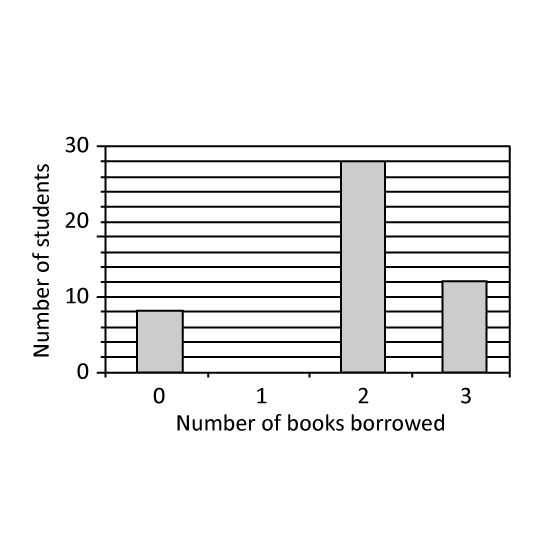
The bar graph shows the number of books borrowed by students in the school library. 14 of the students borrowed 1 book each. How many students borrowed 1 book each?
Level 2 PSLE
The bar graph shows the number of books borrowed by students in the school library. 14 of the students borrowed 1 book each. How many students borrowed 1 book each?