Level 1
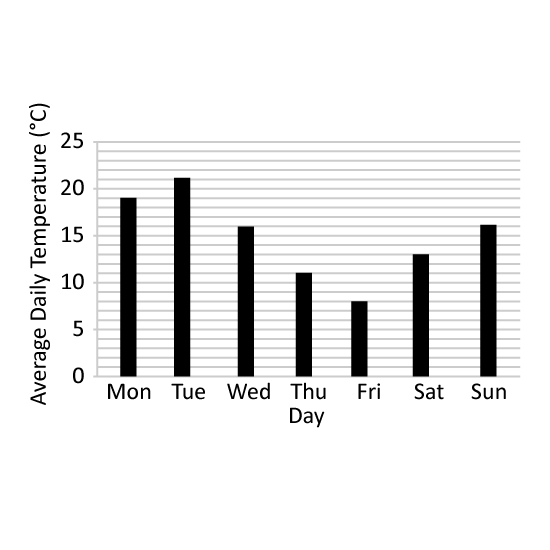
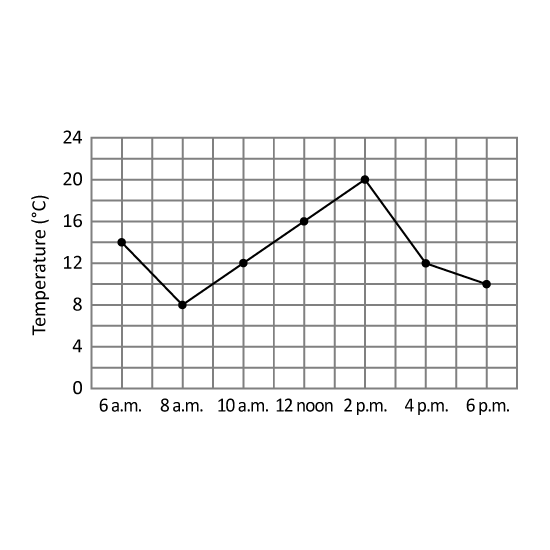
The bar graph shows the average daily temperature experienced by Country A in a week. What was the difference in the highest and lowest average daily temperatures in that week?
Level 1
The bar graph shows the average daily temperature experienced by Country A in a week. What was the difference in the highest and lowest average daily temperatures in that week?
Level 3
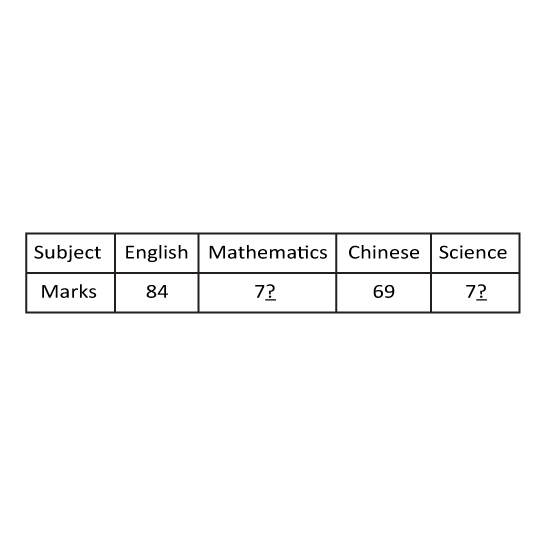
The table shows the marks Michelle scored in her end of year examinations. Michelle scored an average of 75 marks for the 4 subjects. What is the greatest possible mark that she could have scored for Science?
Level 3
The table shows the marks Michelle scored in her end of year examinations. Michelle scored an average of 75 marks for the 4 subjects. What is the greatest possible mark that she could have scored for Science?
Level 3
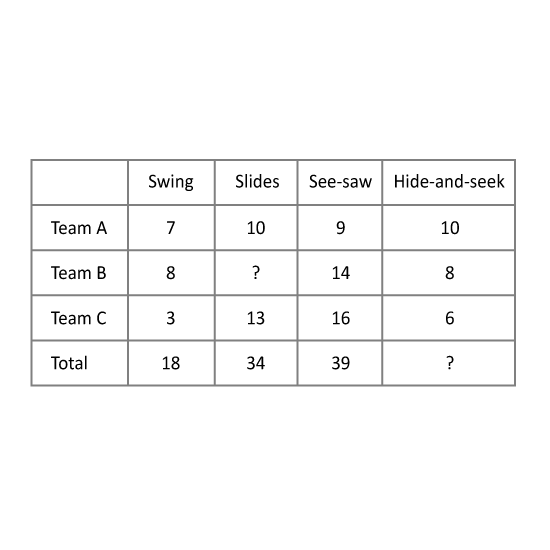
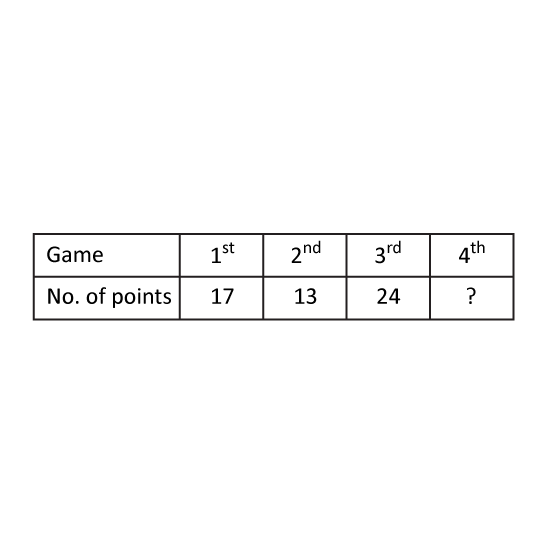
The table shows Fabian scores in 3 of the 4 games that he played.
Fabian will get a prize if his average score for three of the four games is 25 or more. What is the lowest score Fabian must score in the 4th game in order to get a prize?
Level 3
The table shows Fabian scores in 3 of the 4 games that he played.
Fabian will get a prize if his average score for three of the four games is 25 or more. What is the lowest score Fabian must score in the 4th game in order to get a prize?
Level 2
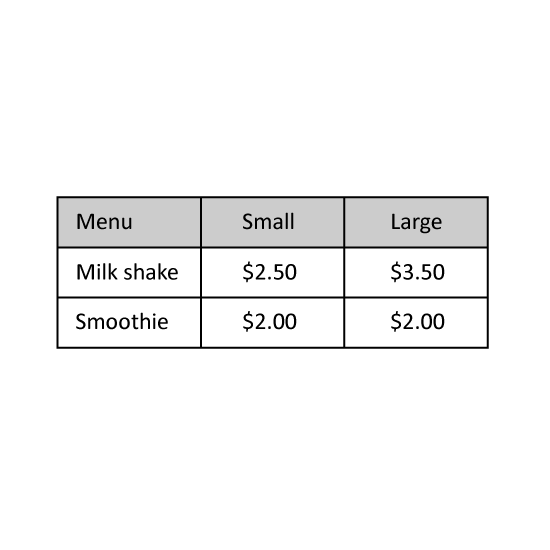
The table shows part of a menu at a fast food restaurant. Benny wanted to buy 1 small smoothie and 1 large milk shake. How much more money would he need if he had only six 50-cent coins in his wallet?
Level 2
The table shows part of a menu at a fast food restaurant. Benny wanted to buy 1 small smoothie and 1 large milk shake. How much more money would he need if he had only six 50-cent coins in his wallet?
Level 3
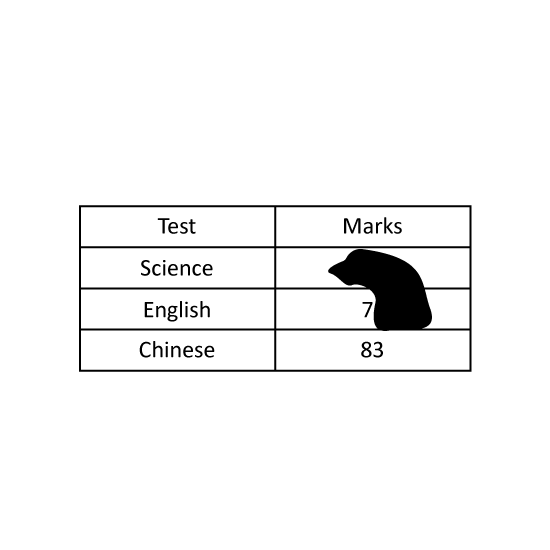
The table shows the marks that Andy scored in his Science, English and Chinese tests. Part of the table is covered by an ink blot. The full marks for each test was 100. The average score for his three tests was 76 marks. Find the highest possible marks that Andy scored in his Science test.
Level 3
The table shows the marks that Andy scored in his Science, English and Chinese tests. Part of the table is covered by an ink blot. The full marks for each test was 100. The average score for his three tests was 76 marks. Find the highest possible marks that Andy scored in his Science test.