Level 3
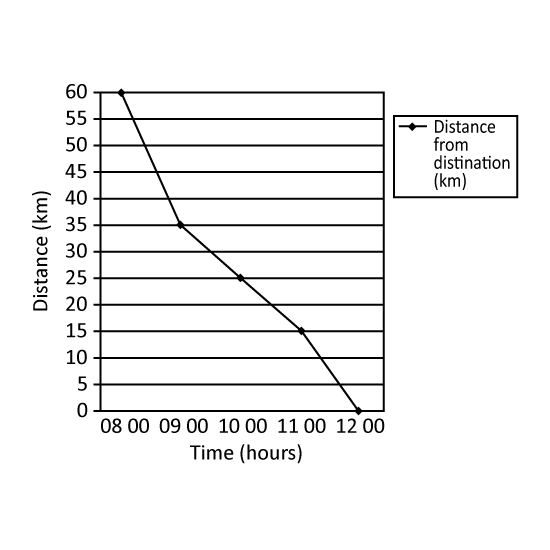
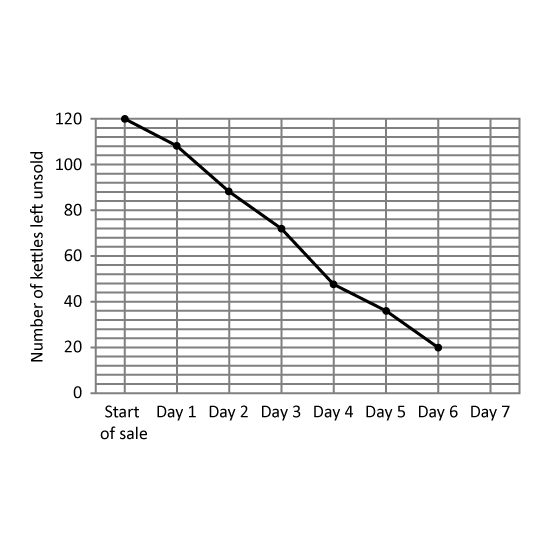
A departmental store had 120 kettles for sale during a 7-day period. The line graph shows the number of kettles left unsold at the end of each day. The number of kettles left unsold at the end of Day 7 was not shown.
On which day (from Day 1 to Day 7), was the greatest number of kettles sold? Give your answer in number. (Eg 1)
The average number of kettles sold for the last three days was 14. How many kettles were sold on Day 7?
Level 3
Some pupils took a Math exam. Their average score was 74.7 marks. One of the pupils' scores was wrongly recorded as 68 marks instead of 86 marks. As a result, the average score was calculated as 73.5 marks. How many pupils sat for the exam?
Level 3 PSLE
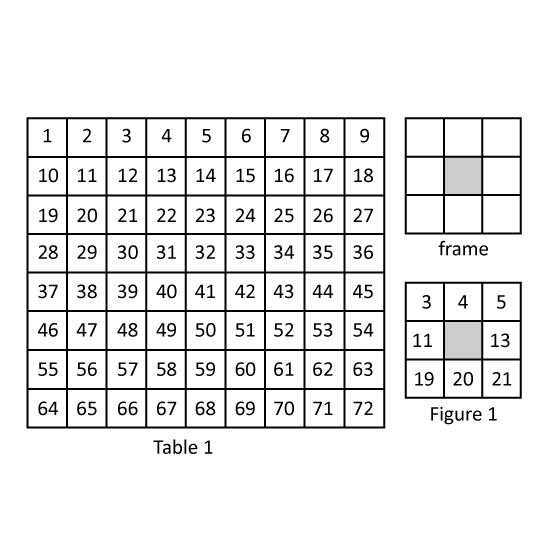
Table 1 consists of numbers from 1 to 72. Kenny and Lionel are given a plastic frame that covers exactly 9 squares of Table 1 with the centre square covered.
Kenny puts the frame on the 9 squares shown in Figure 1. What is the average of the 8 numbers that can be seen in the frame?
Lionel puts the frame on some other 9 squares. The sum of the 8 numbers that can be seen in the frame is 320. What is the smallest number that can be seen in the frame?
Level 3 PSLE
Table 1 consists of numbers from 1 to 72. Kenny and Lionel are given a plastic frame that covers exactly 9 squares of Table 1 with the centre square covered.
Kenny puts the frame on the 9 squares shown in Figure 1. What is the average of the 8 numbers that can be seen in the frame?
Lionel puts the frame on some other 9 squares. The sum of the 8 numbers that can be seen in the frame is 320. What is the smallest number that can be seen in the frame?